Blog from September, 2022
With most sources of satellite remote sensing data, spatial resolution and temporal resolution are inversely related. In other words, as spatial resolution increases, temporal resolution decreases and vice versa. For example, the VIIRS sensor onboard S-NPP and NOAA-20 has a swath width of 3,000 kilometers and each instrument images the entire surface of the Earth at least once daily. The swath width of MODIS onboard Terra and Aqua is narrower at 2,330 km providing slightly less than daily global coverage. However, the finest spatial resolution of active fire detection data that can be gleaned from VIIRS and MODIS at 375 meters and 1 kilometer, respectively, are considered coarse resolution data by most definitions.
In comparison to VIIRS and MODIS, the Operational Land Imager (OLI) onboard both Landsat 8 and Landsat 9 provides active fire detections at relatively finer spatial resolution (30 meters) (please see the related NASA FIRMS blog entry that introduces the Landsat active fire product). Unlike VIIRS and MODIS, OLI has a much narrower swath width of 185 kilometers. The swath of OLI is less than 1/10th the width of a MODIS swath and provides much lower temporal resolution/sampling by comparison (Fig 1).
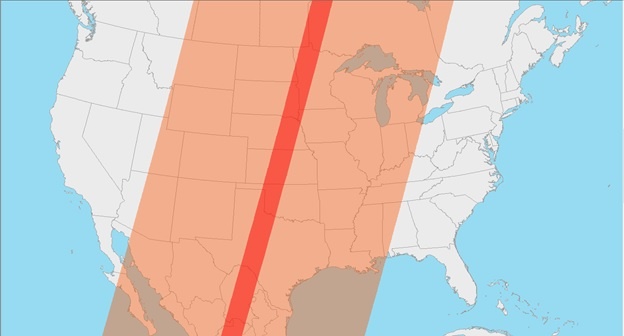 Figure 1 - Example of a 185 km Landsat 9 OLI swath (red) compared to a 2,330 km Terra MODIS swath (orange). Terra MODIS can easily image the entire continental US daily in three consecutive orbits. However, Landsat 8 and Landsat 9 OLI each require multiple orbits over 16 days to provide the same coverage.
How do these characteristics affect the daily availability of active fire data?
The relatively large swath widths of VIIRS and MODIS sensors provide comprehensive satellite observations and derived active fire detection data for the entire globe on a daily basis. Additionally, both sensors provide multiple observations daily within a relatively short period of time where consecutive swaths may overlap, more so at higher latitudes (Fig 2).
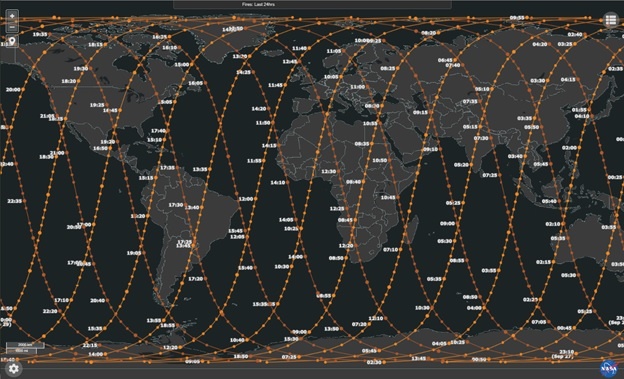 Figure 2 - Example of MODIS and VIIRS orbit tracks showing overlap between tracks, especially at higher latitudes.
Conversely, each Landsat OLI sensor requires 16 days to completely image the surface of the Earth. So, OLI cannot fully image large geographic areas in one day, such as the continental United States, and can only provide partial coverage. However, since the orbits of the two Landsat satellites are 8 days out of phase, the combined temporal resolution of the two OLI sensors enables complete coverage once every 8 days (Fig 3).
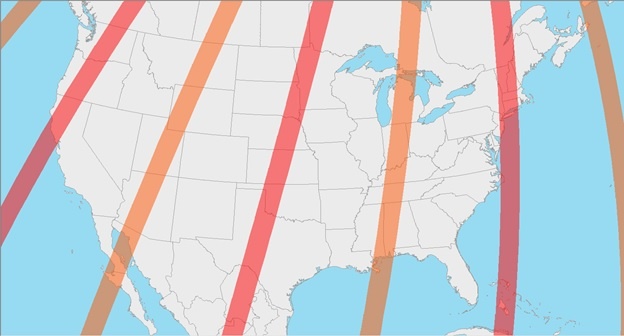
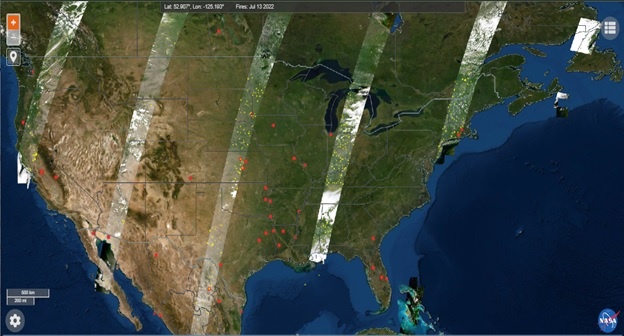
Figure 3 – The top graphic provides an example of the swath coverage for the continental US by OLI onboard Landsat 8 (orange) and Landsat 9 (red) on July 13, 2022. Orbits for each satellite move to the east and west daily and complete a full cycle of coverage every 16 days. The bottom graphic displays the HLS imagery product in FIRMS for July 13, 2022, which contains the acquired Landsat 8 and Landsat 9 imagery over land. Areas along each swath that exceed the predetermined cloud cover threshold are excluded from HLS product in FIRMS. The combined daily coverage of OLI on both Landsat satellites can image the entire continental US, and the globe, every 8 days.
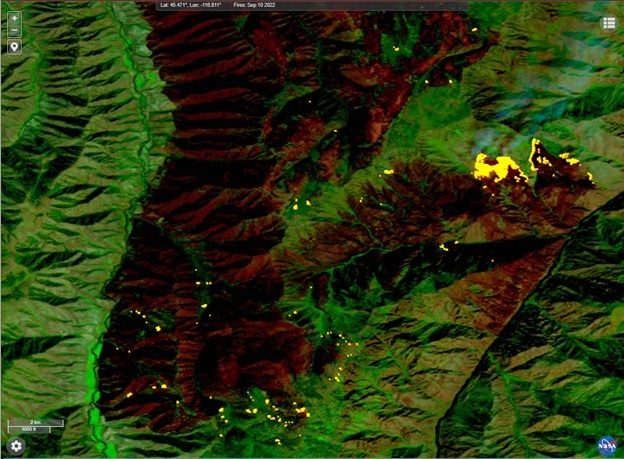
When viewing daily active fire detection data in FIRMS, users should be aware of the high temporal resolution characteristics of VIIRS and MODIS versus Landsat. In Figure 4, active fires detected by Terra MODIS and Landsat on September 10, 2022, for the Pacific Northwest are provided. Landsat active fire detection data, displayed as yellow points, is only available within the 185-kilometer OLI swath. However, MODIS active fire detection data, displayed as red points, is available for the entire region within and outside of the OLI swath. Consequently, updates to the finer resolution Landsat active fire detection data for the entire Earth cannot be provided daily.
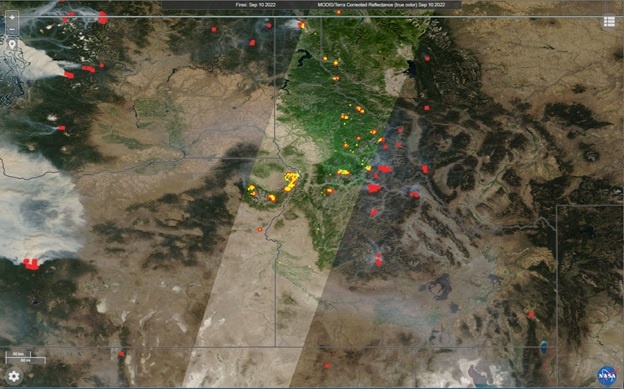
Figure 4 - Active fires detected in the Pacific Northwest on September 10, 2022. 1 kilometer MODIS active fire detections (red) are available for the entire region while 30-meter Landsat 9 active fire detections (yellow) are limited to the 185-kilometer swath (WRS-2 Path 42) acquired on this date.
Earlier this year, we highlighted the availability of Landsat 8 and Landsat 9 Operational Land Imager (OLI) imagery in the FIRMS map viewers. This imagery, provided by NASA's IMPACT project, enables a relatively high spatial resolution perspective of fire activity and post-fire effects. Similar to MODIS and VIIRS, we are now providing active fire data in FIRMS, generated from Landsat observations.
This new near real-time (NRT) Landsat Fire and Thermal Anomaly (LFTA) active fire product is the result of an ongoing collaboration by NASA LANCE/FIRMS, University of Maryland, USDA Forest Service and USGS EROS Data Center. The total elapsed time from satellite overpass to the availability of Landsat active fire detection data in FIRMS is 30 minutes or less. Users should note that these Landsat active fire detection data are provided much sooner than the Harmonized Landsat-Sentinel (HLS) imagery products, that are dynamically generated, and currently available in FIRMS approximately 2 days after acquisition.
Daily Landsat 8 and Landsat 9 OLI data for CONUS and most of Canada and Mexico are collected via direct readout by USGS EROS Data Center in Sioux Falls, South Dakota. At the request of NASA and the USDA Forest Service, USGS developed a near real-time data processing framework that provides Level 1 terrain corrected Landsat OLI imagery. This data is subsequently processed using NASA science data processing algorithms to generate Level 2 30 meter resolution active fire data.
How does Landsat active fire data compare with MODIS and VIIRS active fire data?
Landsat active fire data is more than 1,000 times more resolute than MODIS and more than 160 times more resolute than MODIS and VIIRS, respectively. The algorithm routinely detects fires as small as a few square meters, or smaller, providing spatially explicit detail of location and extent of fire activity at the time of satellite overpass. Active fire fronts, as well as scattered smaller fires within the fire perimeter are routinely detected. However, these relatively high spatial resolution data have a lower temporal resolution compared to the daily observation frequency afforded by MODIS and VIIRS. Between both Landsat OLI instruments, areas in the lower to mid latitudes are imaged every 8 days (please see the related NASA FIRMS blog entry that describes the characteristics of different satellite sensors and their effects on the spatial extent of daily active fire data). The temporal resolution of Landsat data can be increased though collection of nighttime Landsat 8 and Landsat 9 imagery for targeted areas when it can feasibly be done within the confines of current Landsat science and mission priorities.
Viewing the LFTA in FIRMS
The Landsat active fire data can be viewed in both FIRMS global and FIRMS US/Canada. The LFTA are displayed in Basic and Advanced Mode.
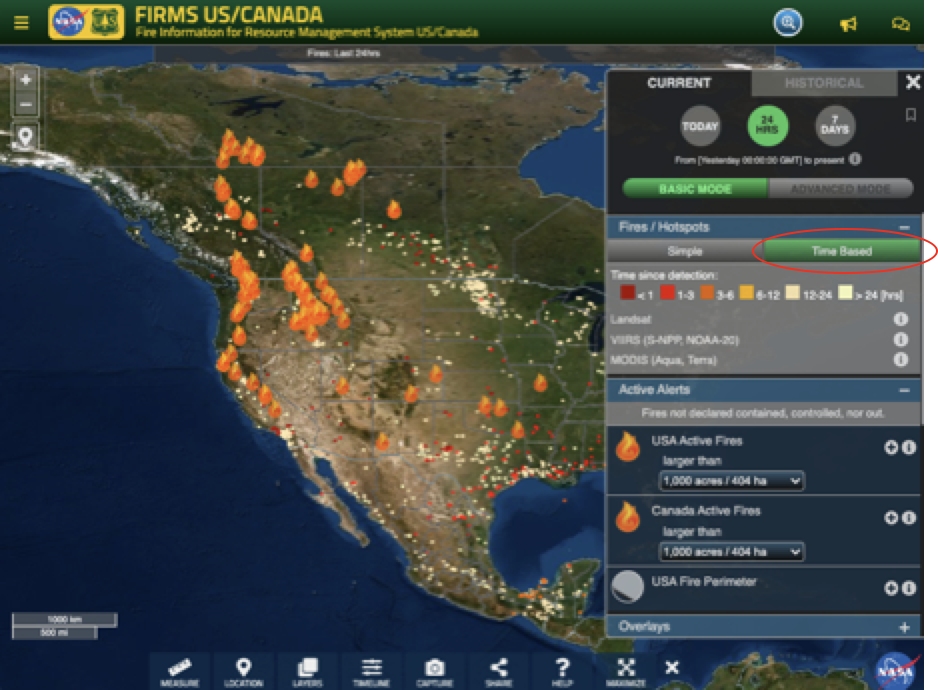
To display the Landsat active fire detections by time since detection, select the "Time Based" option.
To distinguish the Landsat active fire detections from other active fire detections (such as MODIS and VIIRS), select the "Advanced Mode" and "Custom" and select the "+" icon next to the fire detections you want to change. Select the drop down arrow to the right of the color and a color wheel will appear. Select a color and press apply.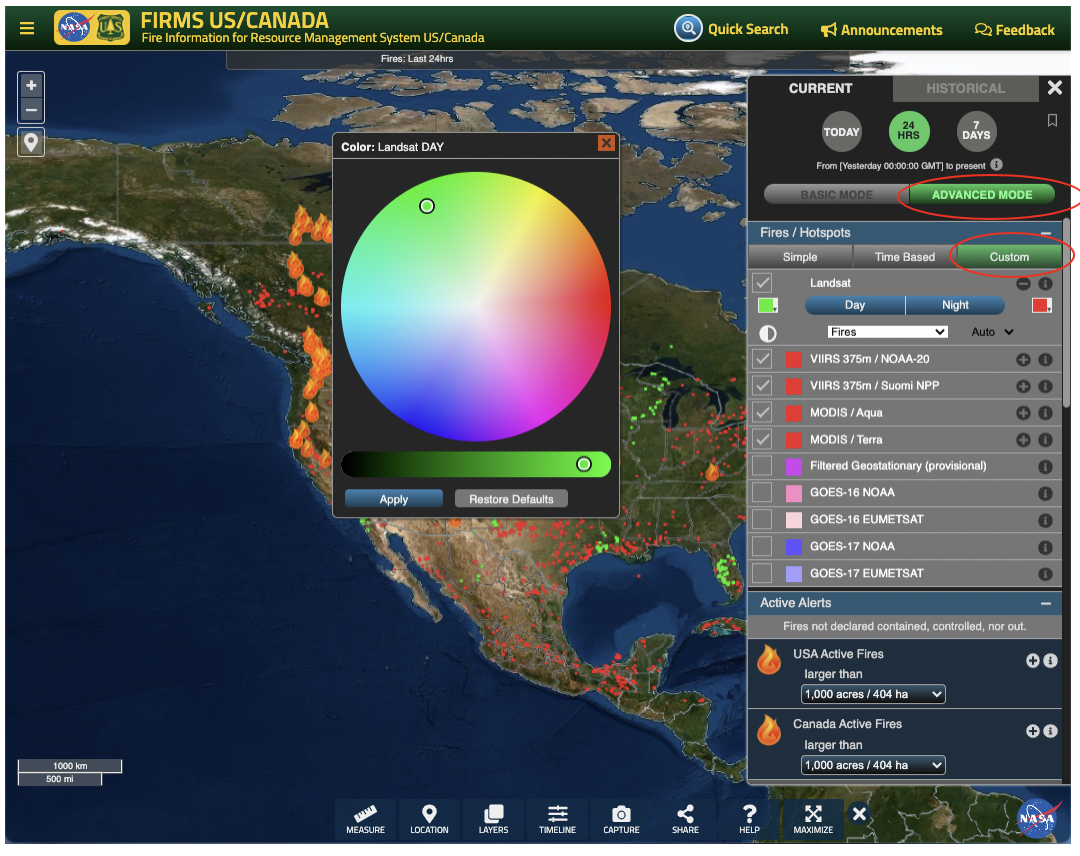
For more information see the FIRMS blog entry on How to customize the fires displayed in FIRMS
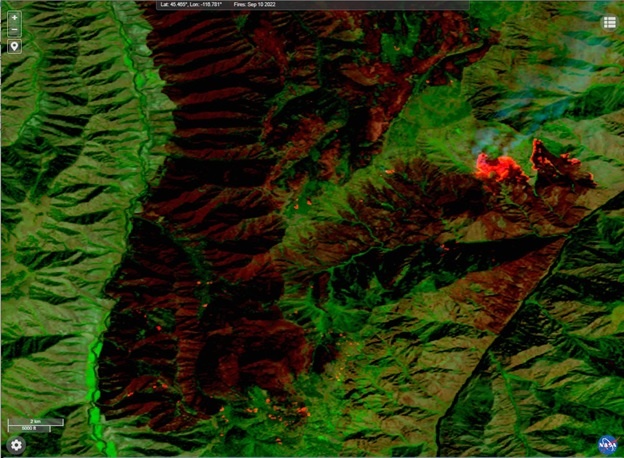
A September 10, 2022 HLS Landsat 9 OLI false color composite image for the southern portion of the Double Creek Fire in northeast Oregon. In the top image, burned areas appear in dark red hues while both isolated and broadly burning areas appear bright orange-red. The bottom image highlights the 30-meter active fire detections (yellow) that correspond to actively burning areas. Users should note that Landsat active fire detection data is available in FIRMS in near real-time approximately 30 minutes after acquisition while corresponding Landsat imagery is generated dynamically and available in FIRMS 2-3 days after acquisition.
The NASA Worldview Snapshots tool enables users to easily create satellite imagery subsets for anywhere in the world. The tool provides access to current and historical imagery captured by Terra and Aqua MODIS and S-NPP and NOAA-20 VIIRS. By simply selecting the desired image product, acquisition date, spatial resolution, output file type as well as entering the latitude/longitude bounding box, users can quickly generate an imagery subset to use for visualization in a GIS or as a graphic in a presentation or document.
For the convenience of users who need to create satellite imagery subsets of geopolitical units, Snapshots has recently been enhanced to include predefined latitude/longitude bounding boxes for countries. After setting the basic parameters for an imagery subset, users can simply select their desired country of interest from the Countries dropdown list in Country/Region Presets box below the map. The red box that subsequently appears on the map indicates the bounding box of the subset to be generated. Users can also increase the default size of the subset boundary extent by 5% to 20% by selecting the desired 5% interval under the Padding dropdown list or manually edit the predefined coordinates as desired in the Bounding Box section of the interface.
Users can also generate imagery subsets for a US state or Canadian province or territory. After selecting either of these two countries, a user can select the State / Province / Region dropdown list to update the subset bounding box extent to the targeted state, province or territory.

A September 9, 2022 Aqua MODIS true color composite image for Oregon generated from NASA Worldview Snapshots. The subset bounding box is defined by the map extent of the state, predefined in Snapshots, and extended by an additional 5% in both dimensions.
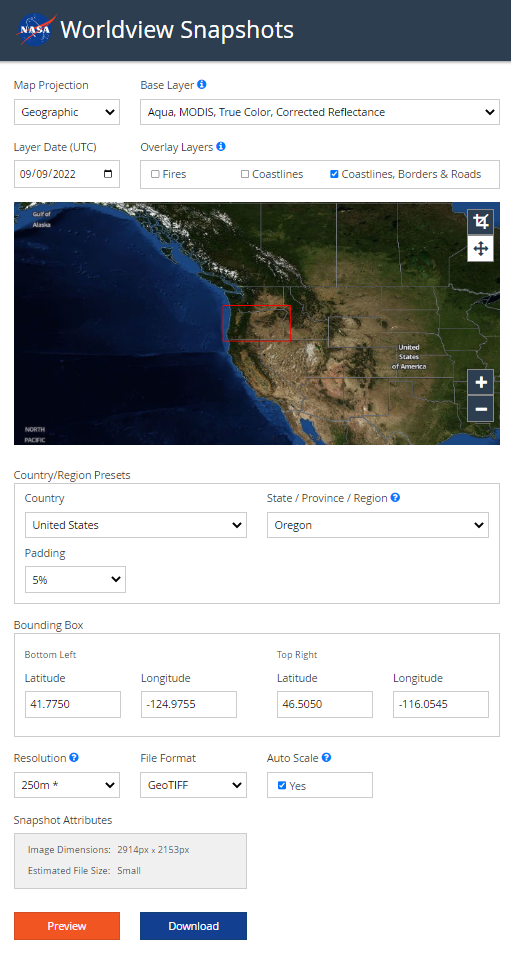
A screenshot of the Worldview Snapshots definition for an imagery subset of the state or Oregon. The updated interface enables users to select a country (as well as a US state and Canadian province/territory) and use its associated map extent as the bounding box coordinates for the subset boundary. If desired, users can increase the size of the predefined bounding box in 5% intervals or edit manually edit the coordinates.