Blog
search
attachments
weblink
advanced
Overview
Content Tools
Satellites can be used to detect all types of fires and other sources of thermal anomalies. This includes thermal activity resulting from burning vegetation (e.g., wildland fires or agricultural burning) as well as energy emitted from other, relatively isolated sources of combustion that emit thermal energy. The latter can include other types of natural heat sources (e.g., volcanic and other geothermal activity) as well as multiple types of industrial heat sources (e.g. mineral processing plants, gas flares, waste incinerators, cement plants, steel plants, petrochemical plants). Discerning this type of thermal activity in satellite active fire detection data requires additional information and analysis capabilities.
The FIRMS team has developed and integrated additional data layers and new capabilities within the FIRMS Fire Map viewer to identify active fire detections not associated with vegetation fires. One of these layers is the Static Thermal Anomalies (STA) - Mask layer. This layer is derived using the cumulative active fire detections data from Terra and Aqua MODIS as well as the 375m S-NPP VIIRS active fire detection data for calendar year 2023. The centroids of the active fire detections are summarized on a 400m grid and, any grid cell containing 5 or more active fire detections over the course of 2023 is extracted, the centroid of the grid cell buffered to approximate a 375m pixel size and smoothed to create a mask of frequently observed or static thermal activity. This mask is then filtered using multiple sources of data obtained from authoritative sources that inventory the locations of industrial heat sources and other natural heat sources not associated with the combustion of vegetation. The final output layer, the Static Thermal Anomalies - Mask, represents a provisional data layer with polygon features defining the approximate geographic extent of thermal activity, detected on a semi-persistent to persistent basis during the calendar year, that are associated with documented industrial heat sources or natural heat sources not related to vegetation fires.
To assist users in identifying detected fires or other thermal activity not associated with the controlled or uncontrolled burning of vegetation, the FIRMS team dynamically analyzes all sources of polar-orbiting active fire detection data (MODIS, VIIRS, and OLI/Landsat) with the Static Thermal Anomalies – Mask to tag detected activity that is likely associated with industrial heat sources or other types of natural heat sources. These dynamically identified detections are represented in the Static Thermal Anomalies - Detections layer and represent probable fires or other heat sources not associated with vegetation fires for the current date range displayed in the FIRMS Fire Map that has been defined by the user. The initial versions of both the Static Thermal Anomalies - Mask and Static Thermal Anomalies - Detections layers are currently provided within FIRMS in the EXPERIMENTAL MODE under the Static Thermal Anomalies accordion. The layers from the authoritative sources that contain the locations of industrial heat sources and other natural heat sources, and were used to filter the Static Thermal Anomalies – Mask, are also provided for reference under the INDUSTRIAL PLANTS AND POWER PLANTS accordions.
The Figure below provides an example of how these layers are used in the FIRMS Fire Map viewer. This example shows the Hughes Fire in California which started at approximately 11:00 AM PST on January 22, 2025 and burned the area surrounding Castaic Lake (red detections). The Static Thermal Anomalies - Detections layer also indicates detected fire activity (cyan) in the southwest corner of the map that occurred in the overnight hours of January 23 associated with a landfill to the northwest of Santa Clarita. These detections are spatially associated with the Static Thermal Anomalies - Mask feature (pink polygon) encompassing that general area. The detected thermal activity is likely due to waste to energy creation activities conducted at the site, as noted in the World Resources Institute Power Plant Database, one of industrial heat source datasets used by FIRMS to develop the Static Thermal Anomalies - Mask. Recent media stories also indicate the landfill has experienced issues in recent years with a persistent underground fire in a portion of the landfill which also may be a contributing factor for these detections. This combination of the Static Thermal Anomalies - Mask layer and Static Thermal Anomalies - Detections, allows FIRMS users to discern that the detected fire activity in the southwest corner of the map is related to these documented activities at the landfill and not associated with the Hughes Fire approximately 9 km to the north. To view this example in FIRMS, use this link
These initial versions of the Static Thermal Anomalies - Mask and Static Thermal Anomalies - Detections layers will continue to be further refined and improved. NASA FIRMS accepts no responsibility for the accuracy and comprehensiveness of the industrial/natural heat source data and, consequently, users should review available metadata about these data available from the data source links provided in the FIRMS layer information and apply appropriate caution when using them or derived Static Thermal Anomalies - Detections data.


Figure: Hughes Fire active fire detections occurring during January 22, 2025 (red), Static Thermal Anomalies - Detections from the overnight hours of January 22-23 associated with the landfill to the southwest (cyan), and Static Thermal Anomalies - Mask layer (pink).
NASA FIRMS recently added the VIIRS Black Marble Nighttime data products as the ultra-sensitivity of the Day/Night band allows large/hot actively burning areas at night to be detected (ahead of the daytime overpass). The products include both the Nighttime At Sensor Radiance and Nighttime Blue/Yellow Composite products from S-NPP and NOAA-20. These data layers are only available in the ADVANCED MODE under the Dynamic Imagery accordion and should be used with caution so as not to confuse city lights or reflected moonlight with fires.
Similar to using the daytime corrected reflectance imagery from MODIS and VIIRS to help interpret wildfire characteristics during the day including wildfire extent, wildfire smoke, and cloud prevalence which may impact detection, the black marble nighttime imagery can be helpful for interpreting wildfire characteristics during the nighttime. The black marble nighttime imagery product is created from a unique Day Night Band (DNB) that is included on the VIIRS instruments aboard S-NPP and NOAA-20. The DNB is a panchromatic band that detects very small amounts of visible light & NIR (resulting from reflected moonlight or sources such as city lights that emit visible light) over a wide wavelength from 500-900nm. The ultra-sensitivity of the VIIRS Day/Night band allows actively burning areas at night to be detected. The sensor resolution of the DNB is 750m and the imagery resolution is resampled to 500m.
Nighttime At Sensor Radiance Example
The example below shows a number of wildfires that occurred near Cascade, Idaho (the Goat and Lava fires) in early September 2024. In the image on the left of the NOAA-20 black marble nighttime at-sensor radiance imagery for 8th September, the extent of the wildfires detected at nighttime can be seen. In the image on the right of the NOAA-20 black marble nighttime at-sensor radiance imagery for 9th September presented at the same scale, the massive expansion of the fires can be seen. To view this example in FIRMS, use this link to display the NOAA-20 black marble nighttime at-sensor radiance imagery for 8th September over the Goat and Lava fires, and use the time slider at the bottom of the map to toggle forward to 9th September. The sensor resolution is 750m, imagery resolution is 500m.


Screenshot from FIRMS US/Canada showing NOAA-20 black marble nighttime at-sensor radiance for 8th September 2024 (top) and for 9th September 2024 (bottom), highlighting the rapid growth of the Goat and Lava fires.
Nighttime Blue/Yellow Composite Example
The VIIRS S-NPP and NOAA-20 Black Marble Nighttime blue/yellow composite imagery is a false composite that uses the VIIRS at-sensor radiance from the DNB and the brightness temperatures from M15, a longwave infrared band. This blue/yellow composite can be useful for assessing light emitted from city lights as well as wildfires at nighttime. City lights and wildfires appear in shades of yellow in IR, and nighttime clouds appear in shades of blue. During bright moonlight conditions, moonlight reflected from cloud tops and the land surface may also provide a yellow hue to those features. The example below shows a NOAA-20 Black Marble Nighttime blue/yellow composite imagery sequence for the Park Fire that occurred near Chico, California in July/August 2024. The imagery sequence includes 24th, 25th, 26th, 27th, 29th July & 6th August.

Series of screenshots from FIRMS US/Canada for 24th, 25th, 26th, 27th, 29th July & 6th August 2024, showing the NOAA-20 Black Marble Nighttime blue/yellow composite imagery sequence for the Park Fire that occurred near Chico, California in July/August 2024 .
To view this example in FIRMS, use this link to display the NOAA-20 black marble nighttime blue/yellow composite imagery for July 24th over the Park Fire, and use the time slider at the bottom of the map to toggle forward to July 25th and onwards to see the progression of the fire based on the light emitted at nighttime. Clouds, which can potentially affect fire detection, can be discerned, and are apparent, over the fire on July 27th (additional information on the impact of clouds is available in this NASA Earthdata article.
This blog explains the considerations when using geostationary active fire data, and shows you how to use the SUB-DAILY data filtering option within the ADVANCED mode of the FIRMS viewer to help track fire progression throughout the day. These steps can also be used for the polar-orbiting satellites.
CONSIDERATIONS WHEN USING GEOSTATIONARY ACTIVE FIRE DATA
Geostationary active fire data are viewable in NASA’s Fire information for Resource Management System (FIRMS). These data are ingested from multiple sources including GOES (NOAA), Meteosat (EUMETSAT) and Himawari (JAXA). Geostationary satellite sensors view the same area of the Earth’s surface at all times and, therefore, many observations are available throughout the day. Polar-orbiting sensors, such as MODIS, VIIRS, and Landsat OLI, on the other hand, view the same area of Earth’s surface less frequently. For example, MODIS and VIIRS generally view the same area of Earth’s surface twice daily; Landsat 8 and Landsat 9 each view the same area of the Earth’s surface every 16 days at the mid latitudes. Towards the poles, polar-orbiting satellites, such as MODIS and VIIRS, view the same area more than twice daily, and up to six times a day, due to the convergence that occurs towards the poles.
The use of geostationary satellite sensors to generate active fire detections, and the development of associated algorithms, is not considered as reliable as those from polar-orbiting satellite sensors such as MODIS and VIIRS. Additionally, geostationary satellite pixels have a coarse spatial resolution. The spatial resolution directly below the satellite (known as the “sub-satellite point”) is 2km for GOES ABI and Himawari AHI, and 3km for Meteosat SEVIRI. The spatial resolution of the pixel (i.e., the pixel size) also systematically grows away from the sub-satellite point towards the edge of the disk. Therefore, the active fire data layers from geostationary satellites viewable in FIRMS should be used with caution. These layers are labeled a beta product as refinement of the algorithms is ongoing, and they are only viewable in the ADVANCED MODE of FIRMS Global and FIRMS US/Canada.
As geostationary satellite sensors view the same area of Earth’s surface at all times and provide repeated observations on a sub-hourly basis, active fire data from geostationary satellites can help track fire progression throughout the day. This can be useful to narrow down the ignition time of a wildfire event, to detect fires not detectable at longer observation intervals, and to track fires that advance quickly in a relatively short period of time.
HOW TO USE THE SUB-DAILY OPTION
The steps below use an example from the Smokehouse Creek Fire in March 2024 in Texas, USA .
- Open the FIRMS US/Canada interactive Fire Map
- Access the ADVANCED MODE by selecting the three horizontal lines in the main menu on the right and selecting ADVANCED MODE
- Use the calendar feature of the TIMELINE to set the date to February 26 2024 (1 DAY)
- Open the LOCATION TOOL and type Stinnett into the Find Location option; select Stinnett, TX, USA.
- Expand the GEOSTATIONARY accordion in Fires / Hotspots section of the FIRMS legend (click the ‘+’ icon to the right of GEOSTATIONARY)
- Deselect all of the active fire layers under the POLAR ORBITING accordion.
- Select the Filtered Geostationary (provisional) layer (click the ‘i’ Info for information about each of the products listed); this layer includes the combined active fire detections from GOES-16 and GOES-18 for the entire day. Note: GOES-16 is the eastern satellite positioned at 75 degrees west longitude and GOES-18 is the western satellite positioned at 135 degrees west longitude.
- To track the progression of a fire throughout the day, FIRMS includes capabilities to filter data using the SUB-DAILY tool.
- On the main menu, toggle on SUB-DAILY (above the calendar icon); note the TIMELINE at the bottom of the map has changed to hours within a given day instead of days.
- Use the clock icon in the main menu to set the time to 22:00 (the SUB-DAILY menu displays the time in UTC; this is 16:00 CST). Note that 04:00 HH:MM appears below the clock icon in blue, this shows all active fires for the previous four hours and is the default time span. Change this to 06:00 HH:MM. Now you are viewing all the filtered geostationary active fire detections for the Smokehouse Creek Fire on 26th February between 16:00-22:00 UTC or 11:00-16:00 CST.
- Note: You can view all the active fire detections within the last 10 minutes (00:10), every 10 minutes up to 1 hour (01:00), and within the last two (02:00), three (03:00) four (04:00), six (06:00), eight (08:00), ten (10:00), twelve (12:00), 18 (18:00), and 24 (24:00) hours (You can also dynamically change the time by sliding the bar along in the TIMELINE at the bottom of the map viewer)

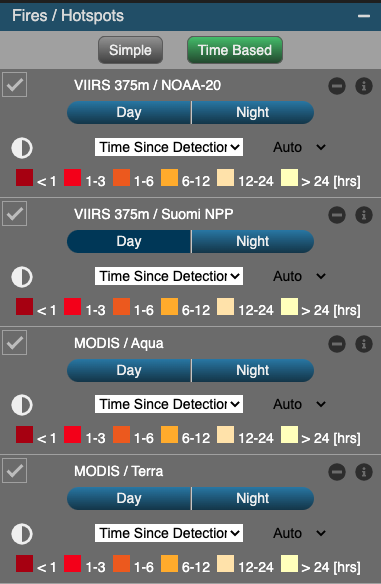
- We would like to investigate when the wildfire was initially detected by the geostationary satellites. Toggle on Time Based under the Fires/Hotspots table of contents. This displays the active fire detections based on Time since detection. Most of these active fire detections (shown in deep red) occurred <1 HOUR earlier than 22:00 UTC (16:00 CST), but some detections (shown in bright red) occurred between 1-3 HOURS earlier than 22:00 (between 19:00-21:00 UTC (13:00-15:00 CST)). One active fire detection (shown in orange) occurred 3-6 HOURs earlier than 22:00 UTC (between 16:00-19:00 UTC (10:00-13:00 CST)).

- When you click on an individual active fire detection, an attribute pop up appears that displays the acquisition time (ACQUIRE_TIME) of the detection (the attribute specifications default to Local Time). Click on the active fire detection that occurred 3-6 HOURS Time since detection (the orange pixel), and select the UTC option to match the UTC time displayed in the menu on the right).
- The active fire detection occurred at 19:00 UTC (13:00 CST). Change the time to 20:00 UTC and set the time interval to 02:00. This will display all the active fire detections that occurred between 18:00-20:00 UTC (12:00-14:00 CST). Several additional active fire detections were observed during this time period.
- Tighten the time span to help identify how the wildfire progressed by changing the time interval to 02:00, several of the active fire detections persist. Incrementally tighten down the time span to further examine the wildfire progression by sequentially selecting 01:00, 00:50, 00:40, 00:30, 00:20, and finally 00:10. Several active fire detections are still present at 00:10 (between 19:50-20:00 UTC (13:50-14:00 CST). Therefore, while the initial active fire detection was observed around 19:00 UTC (13:00 CST), the wildfire expanded rapidly between 19:50-20:00 UTC (13:50-14:00 CST).
- Click on some of these active fire detections to access the attribute pop up and note the acquisition time (ACQUIRE_TIME) of these detections
- Change the time to 23:50 UTC (17:30 CST), change the time interval to 00:10 HH:MM, and use the +10 mins option to reach back in 10 minute increments; visually interpret how the Smokehouse Creek wildfire expanded during the afternoon of 26th February; between the initial active fire detection at 19:00 UTC (13:00 CST) to 23:50 UTC (17:50 CST). This figure includes snapshots from different time intervals

The above example highlights how the geostationary active fire data, which are acquired at a finer temporal resolution, can be used to more tightly identify, for example, a wildfire fire ignition time.
Recent wildfires in Jasper, Alberta, Canada highlighted the impact of cloud on active fire detections. Active fire detections were captured by MODIS and VIIRS on 07/23/24, and to the south/southeast of Jasper on the daytime observations between 12:30PM and 3:00PM PDT on 07/24/24. However, no additional detections were captured for several consecutive days following these detections. FIRMS received multiple questions from users about the wildfire in Jasper and, therefore, this blog explains the reasons for the limited active fire detections during this period.
FIRMS provides active fire detections from both polar orbiting satellites and geostationary satellites. The polar orbiting satellites each typically collect two observations per day over Jasper, Alberta, based on the latitude of Jasper – once during the day and again about 12 hours later in the night. As mentioned above, on 07/24/24 there was some limited fire activity detected by MODIS and VIIRS further south/southeast of Jasper captured on the daytime observations between 1:30PM and 4:00PM MDT. However, if users view the MODIS and VIIRS imagery that were acquired on 07/24/24 (the imagery can be loaded by selecting the VIIRS and MODIS Corrected Reflectance imagery within the Dynamic Imagery dropdown), they will notice that the Jasper area was under heavy cloud cover. Unfortunately, the satellite sensors cannot discern fire activity under heavy clouds or smoke cover and, therefore, under these conditions there will be very limited active fire detection. Thick cloud continued to persist for several days and continued to impact the active fire detections. The images below, acquired on 07/25/24, 07/26/24, and 07/28/24 show thick cloud over the area:

07/25/24

07/26/24

07/28/24
FIRMS also provides active fire detections from geostationary satellites. The GOES geostationary satellites (GOES-16 and GOES-18) that provide coverage over this area, conduct observations at a higher temporal frequency (multiple times per hour), but at a coarser spatial resolution (2km). However, if there is heavy cloud cover or thick smoke, these satellites also cannot detect fire activity. Users can explore the GOES West Geocolor imagery over the area of Jasper to assess the cloud cover (the FIRMS interface needs to be toggled to ADVANCED mode to access these imagery). The following FIRMS FAQs also provide additional information on situations when active fires may not be detected - https://www.earthdata.nasa.gov/faq/firms-faq#ed-not-detected and https://www.earthdata.nasa.gov/faq/firms-faq#ed-modis-fire-size.
FIRMS users routinely leverage active fire detection data derived from MODIS and VIIRS. These sensors are onboard polar-orbiting satellites and provide a “snapshot” of fire activity at the time of satellite overpass for a given geographic area. Polar-orbiting observations by each individual MODIS and VIIRS sensor are conducted once to twice daily in the equatorial region of the globe and as many as eight times daily in the very high latitudes. What if you want multiple observations and updates on detected fire activity every hour? Geostationary satellites sensors can meet that need.
Unlike polar-orbiting satellite sensors, geostationary satellites sensors stay at a fixed point above the equator and follow the Earth’s daily rotation on its axis. Their orbits are 45-50 times higher than MODIS, VIIRS and Landsat sensors which operate in an orbit about 700 to 800 km above the Earth’s surface. These characteristics allow geostationary satellite sensors to move with the Earth’s rotation and persistently observe a very large portion of the Earth’s surface centered on their location.
 coverage spans approximately 160o in both longitudinal and latitudinal directions.")
GOES 16 (GOES East) coverage spans approximately 160o in both longitudinal and latitudinal directions.
Several geostationary platforms and sensors are designed to support meteorological observations and have spectral bands that span the visible, near infrared, and thermal infrared. These capabilities also enable them to support the detection and monitoring of fire activity. Additionally, geostationary sensors provide outstanding temporal resolution acquiring imagery for their entire field of view at 10-15 minute intervals or better. This enables geostationary sensors to potentially detect more fire events and capture their growth and change, particularly in between fire detection observations conducted by sensors on polar-orbiting platforms. However, geostationary sensors have a much coarser spatial resolution than polar-orbiting sensors and can be less sensitive to detecting relatively smaller fires.
Active fire detection data from five geostationary sensors are available in FIRMS and collectively provide global coverage. Two geostationary satellites, GOES-16 and GOES-18, are operated by NOAA and provide coverage for the western hemisphere. The other three satellites, Himawari-8, Meteosat 9 and Meteosat 11, are operated by JAXA and EUMETSAT and provide coverage for the eastern hemisphere and a substantial portion of the western hemisphere. Overlapping coverage is also provided by adjacent sensor fields of view. General information about the geostationary satellites used in FIRMS and their associated sensors, fire detection algorithms and derivative product information are summarized below.
.")
Spatial coverage of geostationary satellites used in FIRMS (Ceamanos et al., 2021).
Satellite | GOES-16, GOES-18 | GOES-16, GOES-18 | Meteosat 9 & 11 | Himawari-8 |
Instrument/Algorithm | Advanced Baseline Imager (ABI) / Fire Detection and Characterization (FDC-HSC) | Advanced Baseline Imager (ABI) / Fire Radiative Power (FRP-PIXEL) | Spinning Enhanced Visible and Infra-Red Imager (SEVIRI) / Fire Radiative Power (FRP-PIXEL) | Advanced Himawari Imager (AHI) / Fire Radiative Power (FRP-PIXEL) |
Satellite Source Agency | NOAA | NOAA | EUMETSAT | JAXA |
Data Source | Instituto Português do Mar e da Atmosfera (IPMA) under Copernicus Atmosphere Monitoring Service (CAMS) | EUMETSAT Land Surface Analysis Applications Facility (LSA SAF) | ||
Coverage and Satellite Locations | Americas East and West GOES-16: 0o, -75.2o GOES-18: 0o, -137.2o | Americas East and West GOES-16: 0o, -75.2o GOES-18: 0o, -137.2o | Europe, Africa and Asia Meteosat 9 (IODC): 0o, 45.5o, Meteosat 11: 0o, 0o | Asia and Australia Himawari 8: 0o, 140o |
More Information/Product User Manual (PUM) | ||||
Algorithm | Filtered Fire Detection and Characterization (FDC-HSC) algorithm (provisional) (Schmidt et al., 2013). See: Why are the geostationary fire data filtered in FIRMS? | Geostationary Fire Thermal Anomaly (FTA) algorithm & FRP retrieval developed by King’s College, London. See Xu et al. (2021) | Geostationary Fire Thermal Anomaly (FTA) algorithm & FRP retrieval developed by King’s College, London. See Wooster et al. (2015) | Geostationary Fire Thermal Anomaly (FTA) algorithm & FRP retrieval developed by King’s College, London. See Xu et at. (2017) |
Summary of geostationary satellites, sensors, algorithms and products used for active fire detection in FIRMS.
Here are two important considerations when using active fire detection data from geostationary satellites: 1) The coarse spatial resolution of geostationary satellites should be taken into consideration; the spatial resolution sub-nadir (i.e. directly below the satellite) is between 2-3Km for the different geostationary satellites (compared to 1Km, 375m, and 30m for MODIS, VIIRS, and Landsat respectively). An active fire could be located anywhere within that 2-3Km pixel. 2), Distortion in the pixel size of geostationary satellites increases towards the poles. This change in pixel size for the GOES-16 geostationary satellite is shown in the figure below. (To view the pixel sizes for the other geostationary satellites visit the FIRMS FAQ What is the spatial resolution of the geostationary satellite observations?)

Credit: Cullingworth and Mueller, 2021; https://doi.org/10.3390/rs13050878
Due to technical and environmental factors, active fire detection outputs from the current generation of geostationary algorithms can be prone to significant errors of commission and/or omission. Consequently, FIRMS considers all geostationary data as provisional or beta, and filters detections to display only those at the higher levels of detection confidence for each product. The filtered geostationary active fire detection data layers from each sensor/algorithm are available under the GEOSTATIONARY section of the Fire / Hotspots group in the FIRMS legend. They are accessible with the Advanced Mode selected. Each geostationary active fire detection layer is named by the source satellite and providing agency (see each layer’s information summary for more details). Additionally, for user convenience, the outputs for GOES FDC-HSC, Meteosat FRP-PIXEL and Himawari FRP-PIXEL algorithms are grouped into a single layer called Filtered Geostationary (provisional).
GOES ABI and Himawari AHI active fire detection data at 2km resolution are observed every 10 minutes throughout a 24-hour period while Meteosat SEVIRI active fire detection data at 3km resolution are observed every 15 minutes. This global harmonized, multi-sensor data stream is enabled by an automated framework developed by the University of Maryland under the auspices of the NASA Applied Sciences Program. All the sources of geostationary active fire detection data are available in FIRMS approximately 30 minutes or less post-observation. Users are advised to note that two active fire detection data products from GOES ABI imagery and derived from separate algorithms are provided in FIRMS.
 Geostationary active fire detection layers in FIRMS
The current versions of geostationary active fire detection algorithms are undergoing additional development, refinement, and tuning. FIRMS will provide outputs based on new or updated algorithms when they are introduced into operational production by the source agencies. Stay tuned for additional FIRMS blog entries with more information on the algorithms, products and characteristics for geostationary active fire detection data and caveats users should consider when utilizing these data in FIRMS.
This blog post was created by Colin Seftor, NASA GSFC
After experiencing the worst fire season on record last year and continuing to face extreme drought conditions in British Columbia, Alberta, and the Northwest Territories, Canada is bracing for what may be another year of severe fires. Two pyrocumulonimbus (PyroCbs) have already been identified around Fort Nelson (one on 11 May and one on 13 May), and the continuing intensity and scale of the fires in the area have caused the evacuation of thousands of people.
PyroCbs are “fire thunderstorms” that can lift large plumes of smoke high up into the air, often reaching the stratosphere. The plumes can then travel long distances, affecting air quality in areas thousands of kilometers from their sources. The location and movement of these smoke plumes are monitored using measurements from satellite instruments such as the Ozone Mapping and Profiler Suite (OMPS) aboard the NASA/NOAA Suomi-NPP, NOAA-20 and NOAA-21 satellites. The OMPS instruments, while primarily designed to determine the amount of atmospheric ozone, can also be used to detect atmospheric aerosols such as volcanic ash, dust, and smoke. One particular OMPS product, the Aerosol Index (AI), is extremely useful for monitoring and tracking the movement of such aerosols because it can detect them over any type of land surface (including ice) and over clouds.
In the figure below, AI measurements from the Suomi-NPP OMPS instrument are shown overlaid on Suomi-NPP Visible Infrared Imaging Radiometer Suite (VIIRS) true-color imagery for May 11-15. Higher AI values (shown in yellow) represent higher density (and altitude) smoke plumes. The images acquired on May 11 and 12 show smoke being transported to northern parts of the United States, significantly impacting air quality in Minnesota and Wisconsin, where air quality alerts were issued. Large sections of eastern Canada were also heavily impacted.

Figure 1: S-NPP OMPS AI values overlaid on true-color imagery from S-NPP VIIRS for May 11-13. Smoke from fires burning in western Canada, particularly from two pyroCbs (one on May 11 and one on May 13) can be seen to affect large areas over Canada and the northern US.
Because of its usefulness in both detecting and monitoring smoke from fires, particularly large scale fire events and pyroCbs, the S-NPP OMPS AI is now included as an overlay in NASA’s Fire Information for Resource Management System (FIRMS) application, which provides near real-time active fire/hotspot locations using satellite-derived fire information to natural resource managers. An example for May 11 is provided in the image and link below:

Figure 2: Screenshot of FIRMS US/Canada showing OMPS AI overlain on the Corrected Reflectance Imagery from S-NPP for May 11,2024. Active fire/hotspots are ovelain as red dots. See: NASA FIRMS US/Canada
Besides the S-NPP OMPS Aerosol Index, the AI measurements from the OMPS instruments on both the NOAA-20 (N-20) and NOAA-21 (N-21) satellites will be implemented in FIRMS later this year. Both N-20 and N-21 AI measurements have the distinct advantage of being taken at a higher spatial resolution. The figure below shows the detail provided by the N-21 AI measurements for May 13 (right) when compared to the S-NPP AI (left).

Figure 3: Comparison of AI measurements from S-NPP (left) and NOAA-21 (right) OMPS instruments. AI products generated from N-21 have a higher spatial resolution (10km x 10km in the nadir direction - looking straight down from the spacecraft), which is 25 times more resolute than the (50km x 50km resolution) S-NPP AI products, providing a much greater level of detail for the smoke plumes.
NASA’s Fire information for Resource Management System (FIRMS) has recently introduced access to VIIRS active fire detection data from NOAA-21. Although NOAA-21 is intended to be the eventual replacement for S-NPP, this addition provides active fire detection data that complements the data already provided by the VIIRS instruments onboard S-NPP and NOAA-20. S-NPP currently has an anticipated end of life date of late 2026. The NOAA-21 active fire detection data are available in each of the new map modes in the FIRMS map viewer: BASIC MODE, ADVANCED MODE, BURNED AREA MODE, US/CANADA MODE and SMOKE/AEROSOL MODE.

The three currently available VIIRS instruments provide observations within approximately one hour of each another. The orbit tracks and overpass times layers in the FIRMS map viewer can be used to ascertain the time of anticipated observation for each instrument at a given location. Additionally, the time of detection for the observed fire activity are available by clicking on the fire detection locations in the FIRMS map viewer. For example, in the map below, VIIRS active fire detection data are simultaneously displayed with customized colors and partial transparency to allow the overlapping detections from different the different VIIRS observation times to be easily discerned (please see the How to Customize the Fires Displayed in FIRMS blog post for directions on how to set user-defined colors for fire detection data). VIIRS active fire detections by S-NPP (yellow) are detected at 17:53 UTC, NOAA-20 (orange) at 18:45 UTC and NOAA-21 (white) at 19:06 UTC. The new NOAA-21 VIIRS active fire detection data are also available from FIRMS as downloadable active fire data in CSV, Esri Shapefile and KMZ formats, OGC compliant web map services and web feature services, and archived data downloads. Users will soon be able to visualize true color and false color composite NOAA-21 VIIRS imagery in the FIRMS map viewer and generate custom subsets using WorldView Snapshots.

At the end of 2023, NASA’s Fire information for Resource Management System (FIRMS) released an expanded User Interface (UI) for both FIRMS Global and FIRMS US/Canada. The objectives of the expanded UI are to:
- Support an increasingly diverse set of users
- Increase visibility/access to other FIRMS products/services
- Maintain distinctive UIs for user levels, use cases & prototype products
- Enhance ability to filter and visualize data

The expanded UI includes multiple modes, all accessible within the Main Menu. These include:
- BASIC MODE: a concise interface containing essential layers to quickly identify and visualize current/recent fire activity and factors affecting satellite fire detection.
- ADVANCED MODE: designed for those already versed in FIRMS, the ADVANCED MODE provides access to all the satellite imagery (including active fire data from geostationary satellites), other satellite data products and ancillary geospatial data available through FIRMS in order to visualize, explore and analyze for current and past fire activity.
- BURNED AREA: provides satellite imagery and other derived satellite data products to detect, visualize, explore and analyze burned area.
- US/CANADA: provides satellite imagery, and other satellite data products to visualize, explore and analyze current and past fire activity in the United States and Canada. Additional geospatial data available through FIRMS US/Canada inform and support strategic wildland fire management users.
- SMOKE/AEROSOLS: provides satellite products useful for highlighting the extent of wildfire smoke, as well as tracking the transport of smoke.
- EXPERIMENTAL (in progress): will provide new and/or prototype satellite data products for assessment and evaluation by the user community.
- FIRE ALERTS: for users to sign up and receive email alerts about detected fire activity through FIRMS.
- DOWNLOADS: provides users with access to archived data for review and download.
A Youtube video is available here which includes an overview of the Expanded UI, along with multiple demonstrations.
For more information on FIRMS see our Additional Resources Page.
Earlier this year, we highlighted the availability of Landsat 8 and Landsat 9 Operational Land Imager (OLI) imagery in the FIRMS map viewers. This imagery, provided by NASA's IMPACT project, enables a relatively high spatial resolution perspective of fire activity and post-fire effects. Similar to MODIS and VIIRS, we are now providing active fire data in FIRMS, generated from Landsat observations.
This new near real-time (NRT) Landsat Fire and Thermal Anomaly (LFTA) active fire product is the result of an ongoing collaboration by NASA LANCE/FIRMS, University of Maryland, USDA Forest Service and USGS EROS Data Center. The total elapsed time from satellite overpass to the availability of Landsat active fire detection data in FIRMS is 30 minutes or less. Users should note that these Landsat active fire detection data are provided much sooner than the Harmonized Landsat-Sentinel (HLS) imagery products, that are dynamically generated, and currently available in FIRMS approximately 2 days after acquisition.
Daily Landsat 8 and Landsat 9 OLI data for CONUS and most of Canada and Mexico are collected via direct readout by USGS EROS Data Center in Sioux Falls, South Dakota. At the request of NASA and the USDA Forest Service, USGS developed a near real-time data processing framework that provides Level 1 terrain corrected Landsat OLI imagery. This data is subsequently processed using NASA science data processing algorithms to generate Level 2 30 meter resolution active fire data.
How does Landsat active fire data compare with MODIS and VIIRS active fire data?
Landsat active fire data is more than 1,000 times more resolute than MODIS and more than 160 times more resolute than MODIS and VIIRS, respectively. The algorithm routinely detects fires as small as a few square meters, or smaller, providing spatially explicit detail of location and extent of fire activity at the time of satellite overpass. Active fire fronts, as well as scattered smaller fires within the fire perimeter are routinely detected. However, these relatively high spatial resolution data have a lower temporal resolution compared to the daily observation frequency afforded by MODIS and VIIRS. Between both Landsat OLI instruments, areas in the lower to mid latitudes are imaged every 8 days (please see the related NASA FIRMS blog entry that describes the characteristics of different satellite sensors and their effects on the spatial extent of daily active fire data). The temporal resolution of Landsat data can be increased though collection of nighttime Landsat 8 and Landsat 9 imagery for targeted areas when it can feasibly be done within the confines of current Landsat science and mission priorities.
Viewing the LFTA in FIRMS
The Landsat active fire data can be viewed in both FIRMS global and FIRMS US/Canada. The LFTA are displayed in Basic and Advanced Mode.
To display the Landsat active fire detections by time since detection, select the "Time Based" option.
To distinguish the Landsat active fire detections from other active fire detections (such as MODIS and VIIRS), select the "Advanced Mode" and "Custom" and select the "+" icon next to the fire detections you want to change. Select the drop down arrow to the right of the color and a color wheel will appear. Select a color and press apply.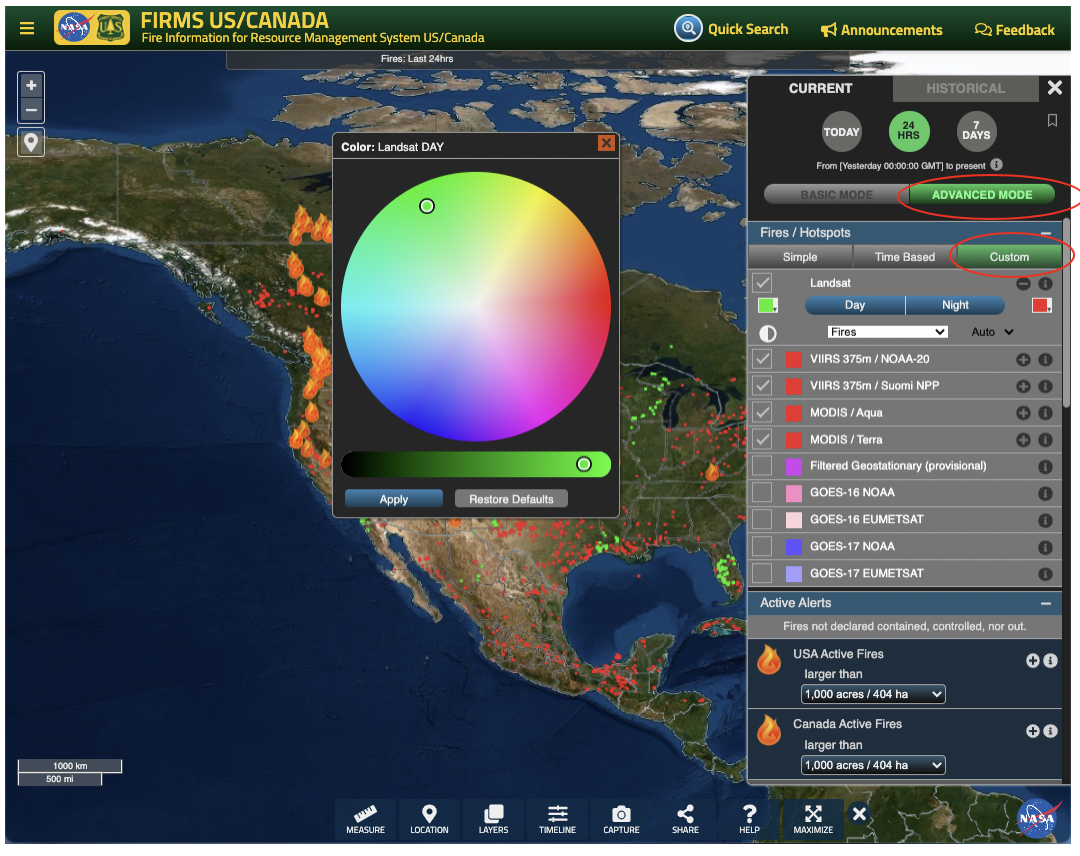
For more information see the FIRMS blog entry on How to customize the fires displayed in FIRMS
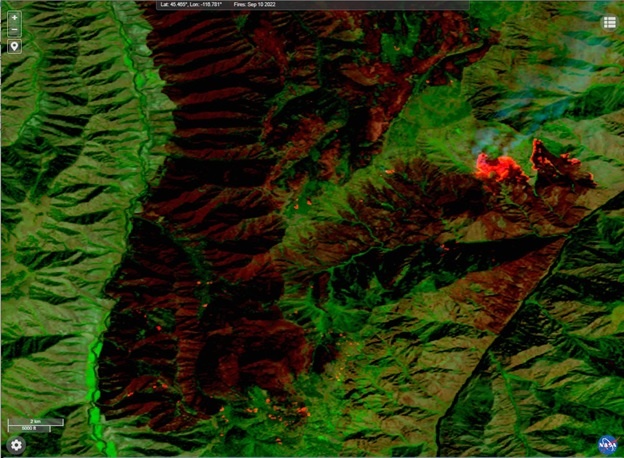
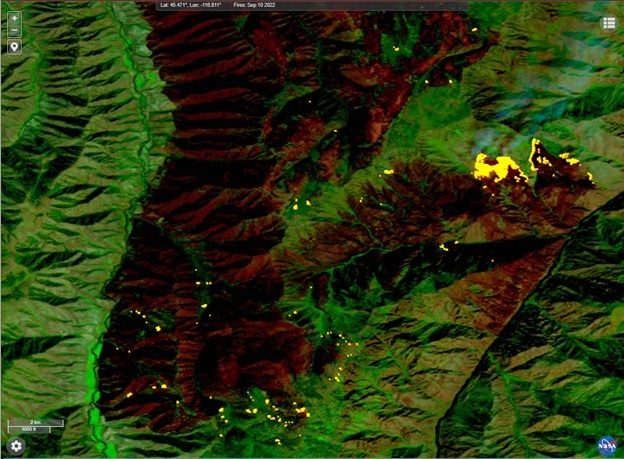
A September 10, 2022 HLS Landsat 9 OLI false color composite image for the southern portion of the Double Creek Fire in northeast Oregon. In the top image, burned areas appear in dark red hues while both isolated and broadly burning areas appear bright orange-red. The bottom image highlights the 30-meter active fire detections (yellow) that correspond to actively burning areas. Users should note that Landsat active fire detection data is available in FIRMS in near real-time approximately 30 minutes after acquisition while corresponding Landsat imagery is generated dynamically and available in FIRMS 2-3 days after acquisition.
With most sources of satellite remote sensing data, spatial resolution and temporal resolution are inversely related. In other words, as spatial resolution increases, temporal resolution decreases and vice versa. For example, the VIIRS sensor onboard S-NPP and NOAA-20 has a swath width of 3,000 kilometers and each instrument images the entire surface of the Earth at least once daily. The swath width of MODIS onboard Terra and Aqua is narrower at 2,330 km providing slightly less than daily global coverage. However, the finest spatial resolution of active fire detection data that can be gleaned from VIIRS and MODIS at 375 meters and 1 kilometer, respectively, are considered coarse resolution data by most definitions.
In comparison to VIIRS and MODIS, the Operational Land Imager (OLI) onboard both Landsat 8 and Landsat 9 provides active fire detections at relatively finer spatial resolution (30 meters) (please see the related NASA FIRMS blog entry that introduces the Landsat active fire product). Unlike VIIRS and MODIS, OLI has a much narrower swath width of 185 kilometers. The swath of OLI is less than 1/10th the width of a MODIS swath and provides much lower temporal resolution/sampling by comparison (Fig 1).
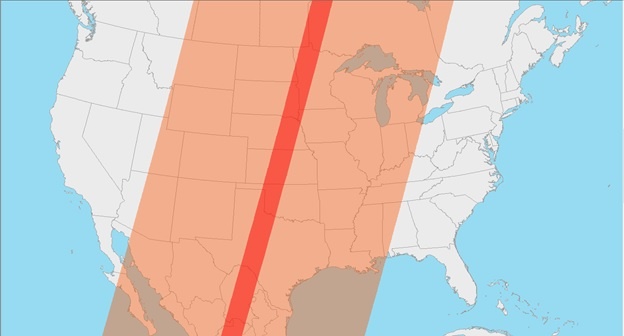 Figure 1 - Example of a 185 km Landsat 9 OLI swath (red) compared to a 2,330 km Terra MODIS swath (orange). Terra MODIS can easily image the entire continental US daily in three consecutive orbits. However, Landsat 8 and Landsat 9 OLI each require multiple orbits over 16 days to provide the same coverage.
How do these characteristics affect the daily availability of active fire data?
The relatively large swath widths of VIIRS and MODIS sensors provide comprehensive satellite observations and derived active fire detection data for the entire globe on a daily basis. Additionally, both sensors provide multiple observations daily within a relatively short period of time where consecutive swaths may overlap, more so at higher latitudes (Fig 2).
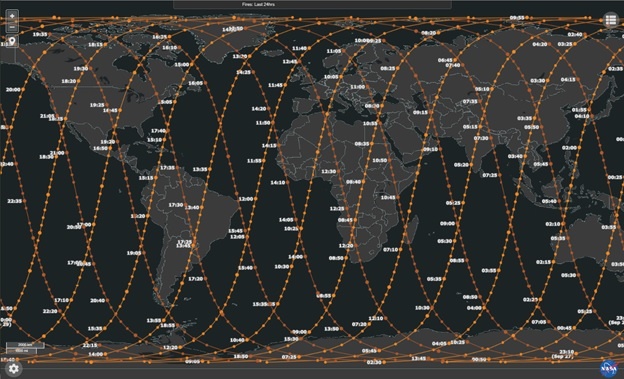 Figure 2 - Example of MODIS and VIIRS orbit tracks showing overlap between tracks, especially at higher latitudes.
Conversely, each Landsat OLI sensor requires 16 days to completely image the surface of the Earth. So, OLI cannot fully image large geographic areas in one day, such as the continental United States, and can only provide partial coverage. However, since the orbits of the two Landsat satellites are 8 days out of phase, the combined temporal resolution of the two OLI sensors enables complete coverage once every 8 days (Fig 3).
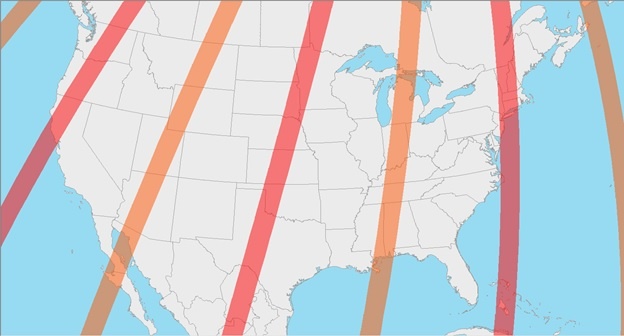
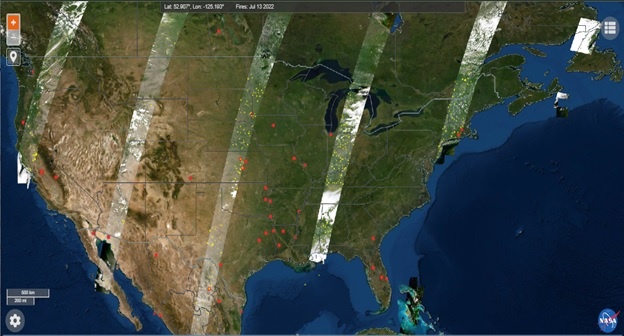
Figure 3 – The top graphic provides an example of the swath coverage for the continental US by OLI onboard Landsat 8 (orange) and Landsat 9 (red) on July 13, 2022. Orbits for each satellite move to the east and west daily and complete a full cycle of coverage every 16 days. The bottom graphic displays the HLS imagery product in FIRMS for July 13, 2022, which contains the acquired Landsat 8 and Landsat 9 imagery over land. Areas along each swath that exceed the predetermined cloud cover threshold are excluded from HLS product in FIRMS. The combined daily coverage of OLI on both Landsat satellites can image the entire continental US, and the globe, every 8 days.
When viewing daily active fire detection data in FIRMS, users should be aware of the high temporal resolution characteristics of VIIRS and MODIS versus Landsat. In Figure 4, active fires detected by Terra MODIS and Landsat on September 10, 2022, for the Pacific Northwest are provided. Landsat active fire detection data, displayed as yellow points, is only available within the 185-kilometer OLI swath. However, MODIS active fire detection data, displayed as red points, is available for the entire region within and outside of the OLI swath. Consequently, updates to the finer resolution Landsat active fire detection data for the entire Earth cannot be provided daily.
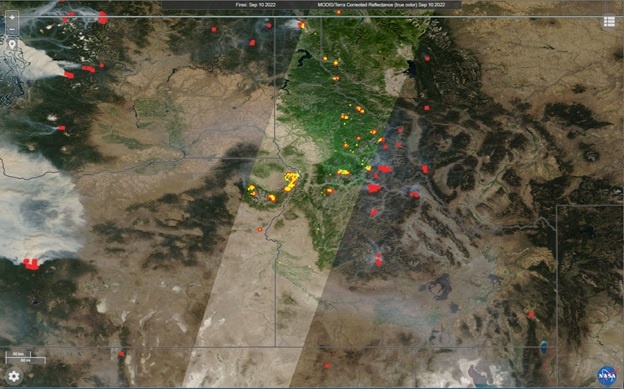
Figure 4 - Active fires detected in the Pacific Northwest on September 10, 2022. 1 kilometer MODIS active fire detections (red) are available for the entire region while 30-meter Landsat 9 active fire detections (yellow) are limited to the 185-kilometer swath (WRS-2 Path 42) acquired on this date.
The NASA Worldview Snapshots tool enables users to easily create satellite imagery subsets for anywhere in the world. The tool provides access to current and historical imagery captured by Terra and Aqua MODIS and S-NPP and NOAA-20 VIIRS. By simply selecting the desired image product, acquisition date, spatial resolution, output file type as well as entering the latitude/longitude bounding box, users can quickly generate an imagery subset to use for visualization in a GIS or as a graphic in a presentation or document.
For the convenience of users who need to create satellite imagery subsets of geopolitical units, Snapshots has recently been enhanced to include predefined latitude/longitude bounding boxes for countries. After setting the basic parameters for an imagery subset, users can simply select their desired country of interest from the Countries dropdown list in Country/Region Presets box below the map. The red box that subsequently appears on the map indicates the bounding box of the subset to be generated. Users can also increase the default size of the subset boundary extent by 5% to 20% by selecting the desired 5% interval under the Padding dropdown list or manually edit the predefined coordinates as desired in the Bounding Box section of the interface.
Users can also generate imagery subsets for a US state or Canadian province or territory. After selecting either of these two countries, a user can select the State / Province / Region dropdown list to update the subset bounding box extent to the targeted state, province or territory.

A September 9, 2022 Aqua MODIS true color composite image for Oregon generated from NASA Worldview Snapshots. The subset bounding box is defined by the map extent of the state, predefined in Snapshots, and extended by an additional 5% in both dimensions.
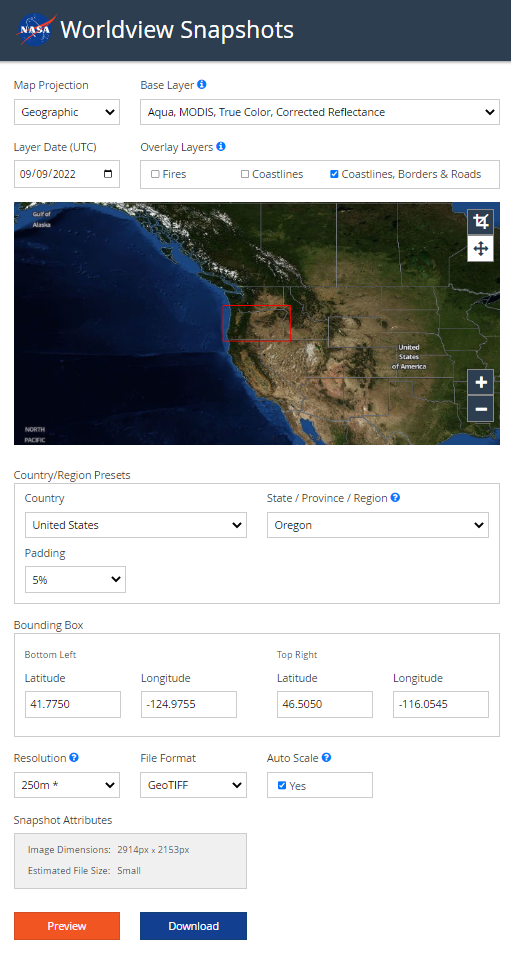
A screenshot of the Worldview Snapshots definition for an imagery subset of the state or Oregon. The updated interface enables users to select a country (as well as a US state and Canadian province/territory) and use its associated map extent as the bounding box coordinates for the subset boundary. If desired, users can increase the size of the predefined bounding box in 5% intervals or edit manually edit the coordinates.
Earlier this year, FIRMS integrated the Harmonized Landsat/Sentinel-2 (HLS) Imagery product. This data stream has recently been enhanced with the integration of Landsat 9 data. Users can now integrate HLS True Color and False Color Composite Imagery from Landsat 9 in addition to Landsat 8. Both Landsat instruments image every location on the Earth's surface at least every 16 days and their respective orbits are 8 days out of phase. As a result, they provide 8 day repeat coverage of any area on the globe. With the two Landsat instruments and two Sentinel-2 instruments, the HLS data stream allows for 30 meter land surface observations every 2-3 days.
HLS data services are made available by the NASA Interagency Implementation and Advanced Concepts Team (IMPACT) and can be visualized in FIRMS map viewers approximately 2-4 days after acquisition. Please see the April 2022 FIRMS blog post for additional information on the HLS data product and how to access it in FIRMS.
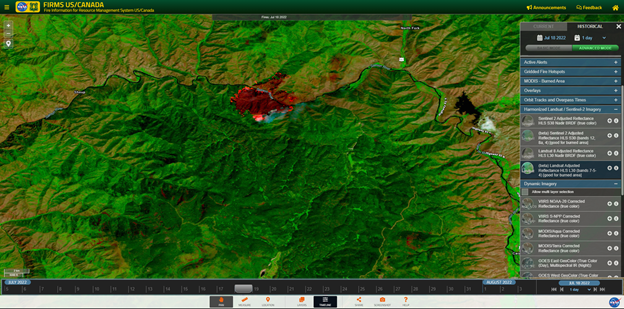
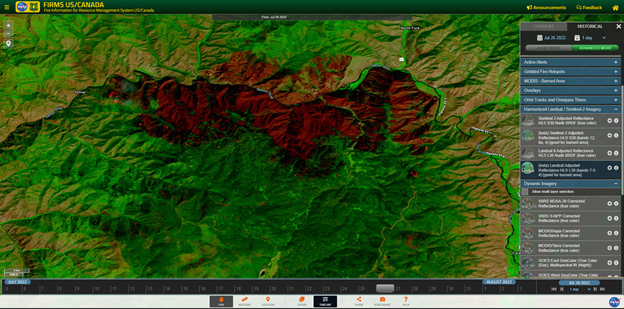
HLS false color composite image for the Moose Fire in northeast Idaho acquired by Landsat 8 on July 18, 2022 (top). The HLS false color image acquired on July 26, 2022 by Landsat 9 (bottom) illustrates the growth of the fire over that 8 day period. Note active fire areas in these images appear as glowing orange.
This blog shows you how to:
- change the colors of the fires/thermal anomalies
- change the fire pixel size
- show only day or night detections
- color code fires by Fire Radiative Power (FRP), Confidence or Time Since Detection
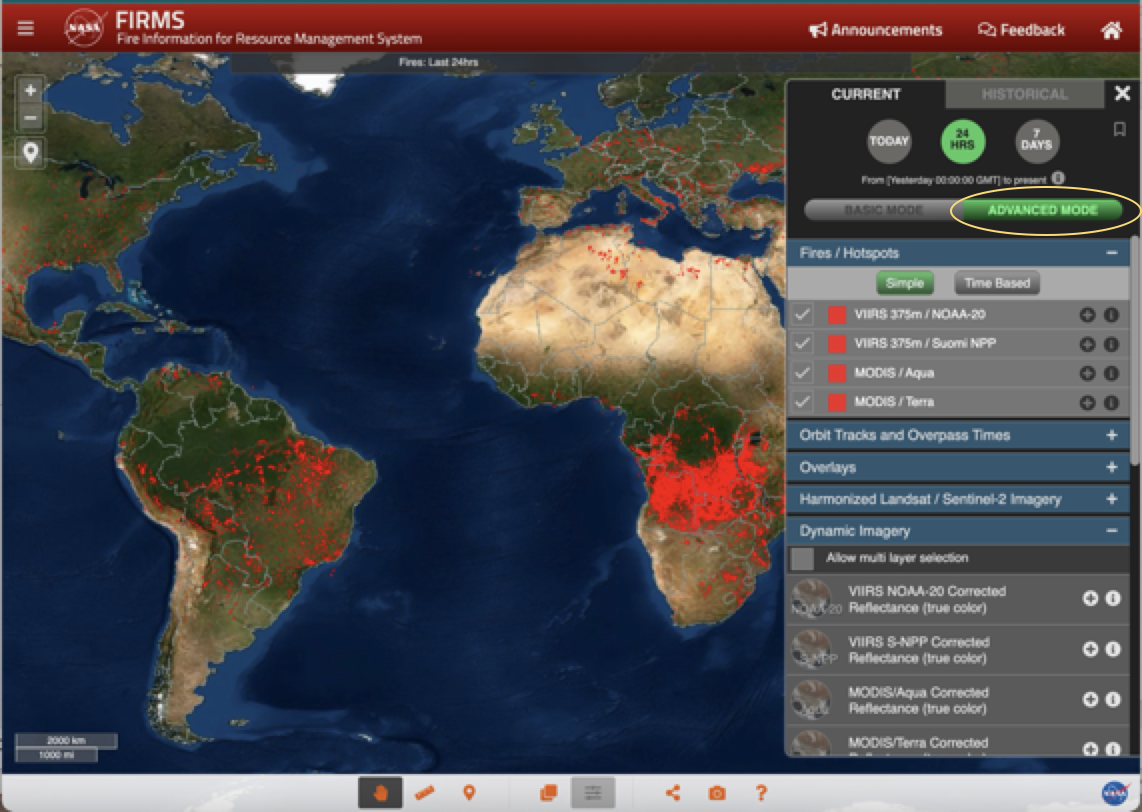
CHANGE FIRE COLOR BY INSTRUMENT
The default color for the MODIS and VIIRS thermal anomalies is red. There are times when it is useful to be able to distinguish between instruments (MODIS/VIIRS) or day/night detections. To do this Select ADVANCED MODE in the Layer List on the right of the map (see image below)
Select the "+" icon next to the fire detections you want to change.
Select the drop down arrow to the right of the color and a color wheel will appear. Select a color and press apply.
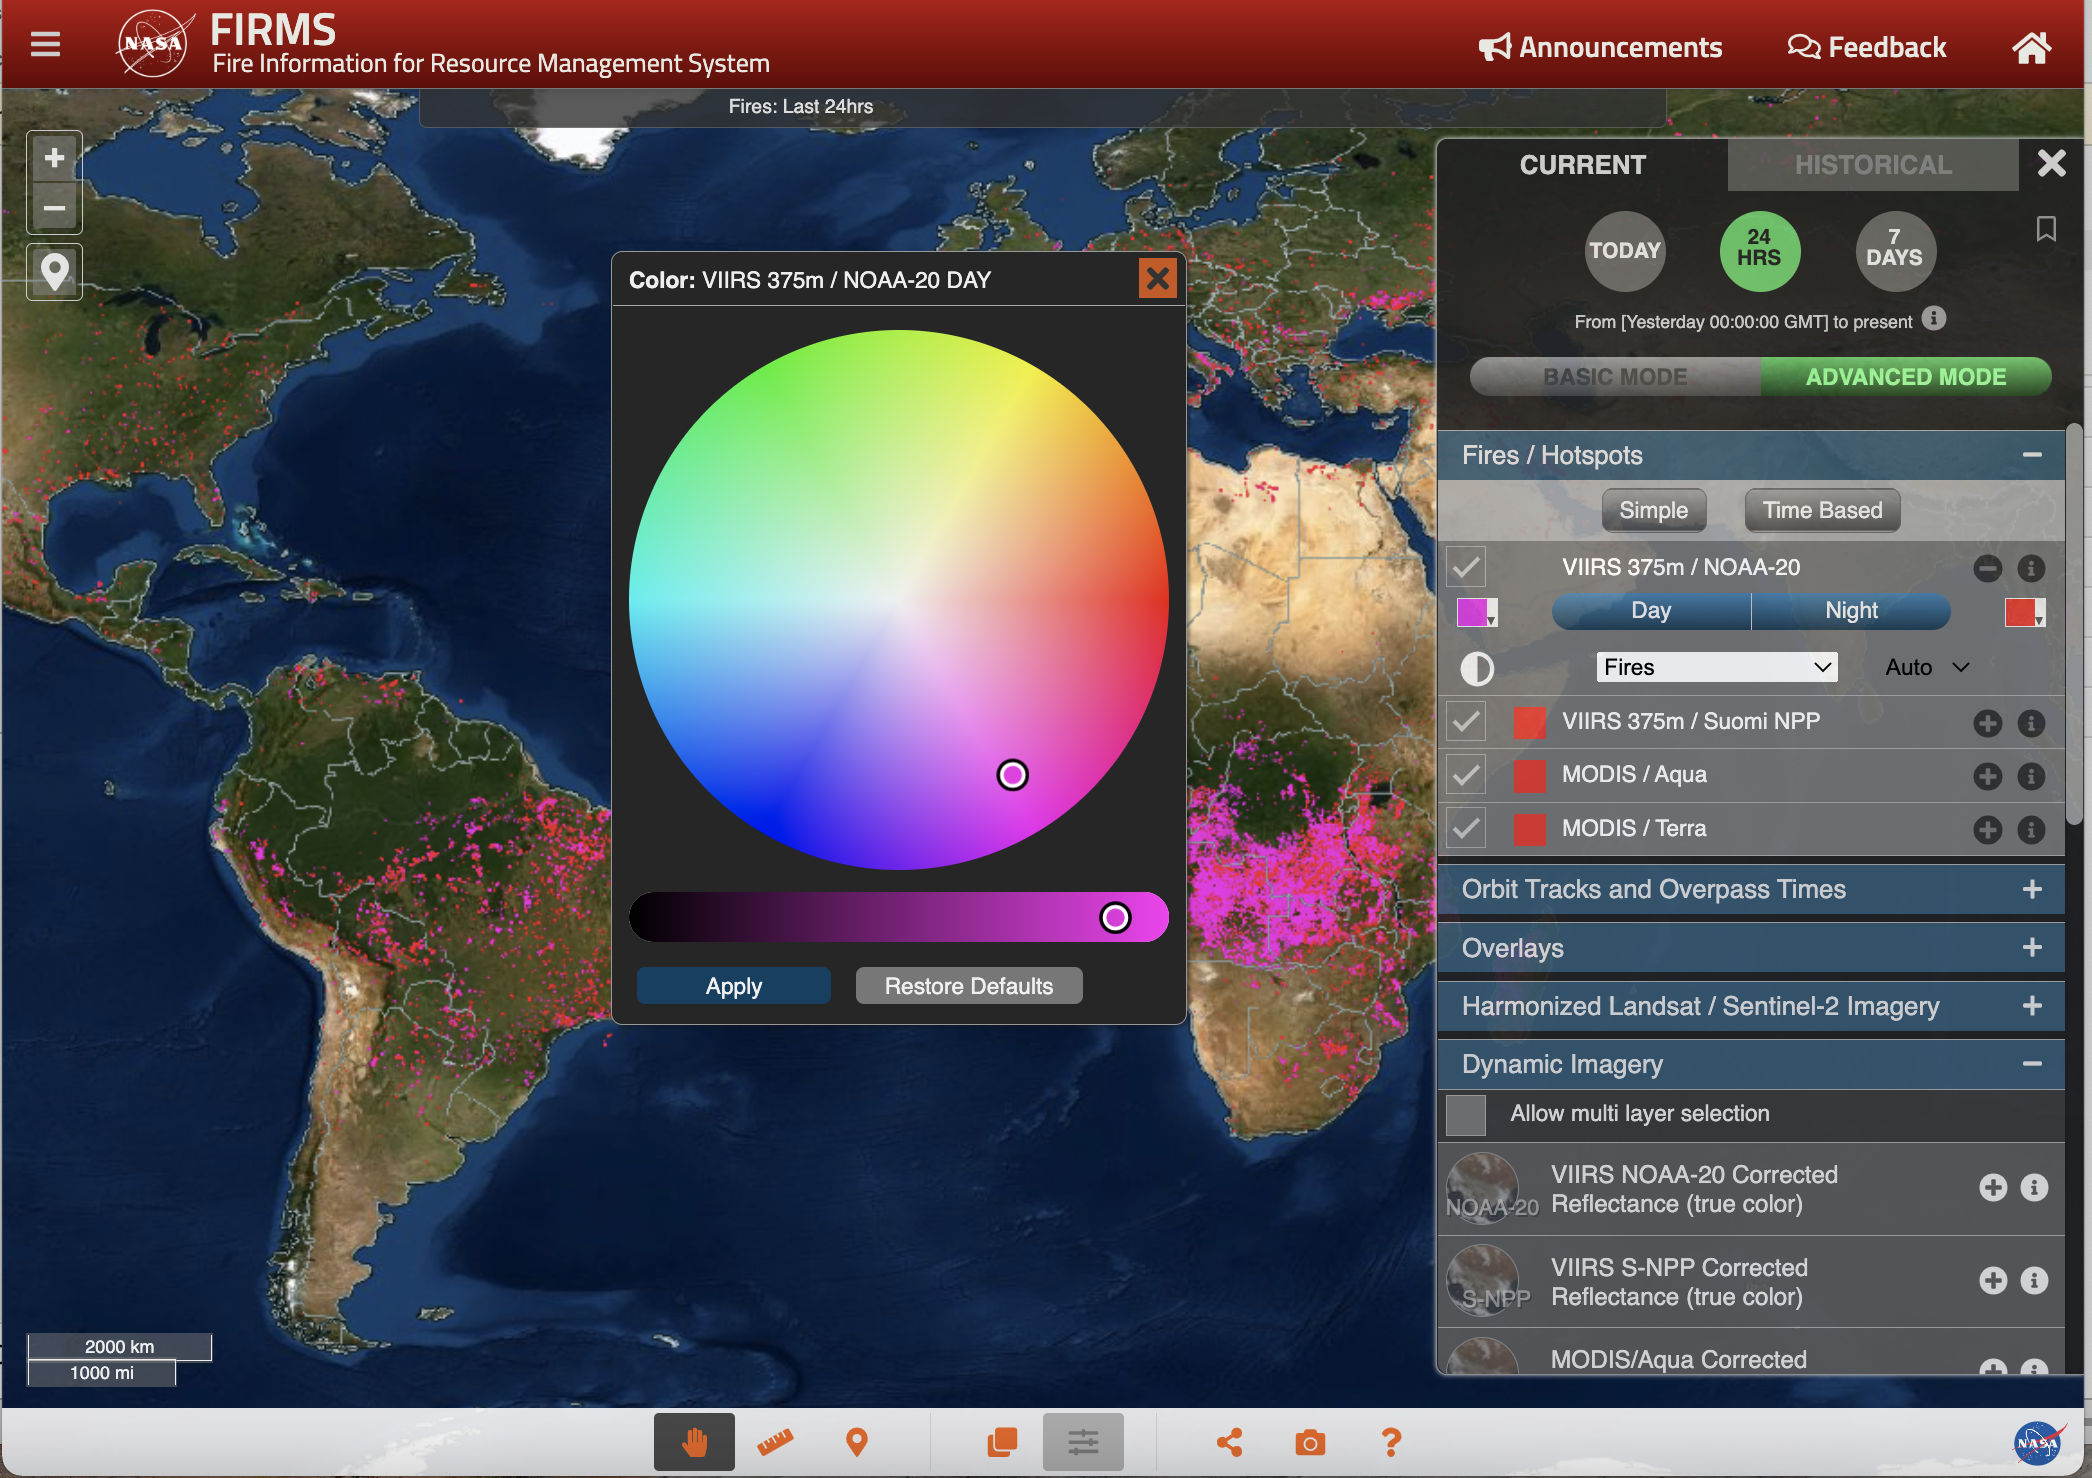
This step can be repeated for other fire detection categories.
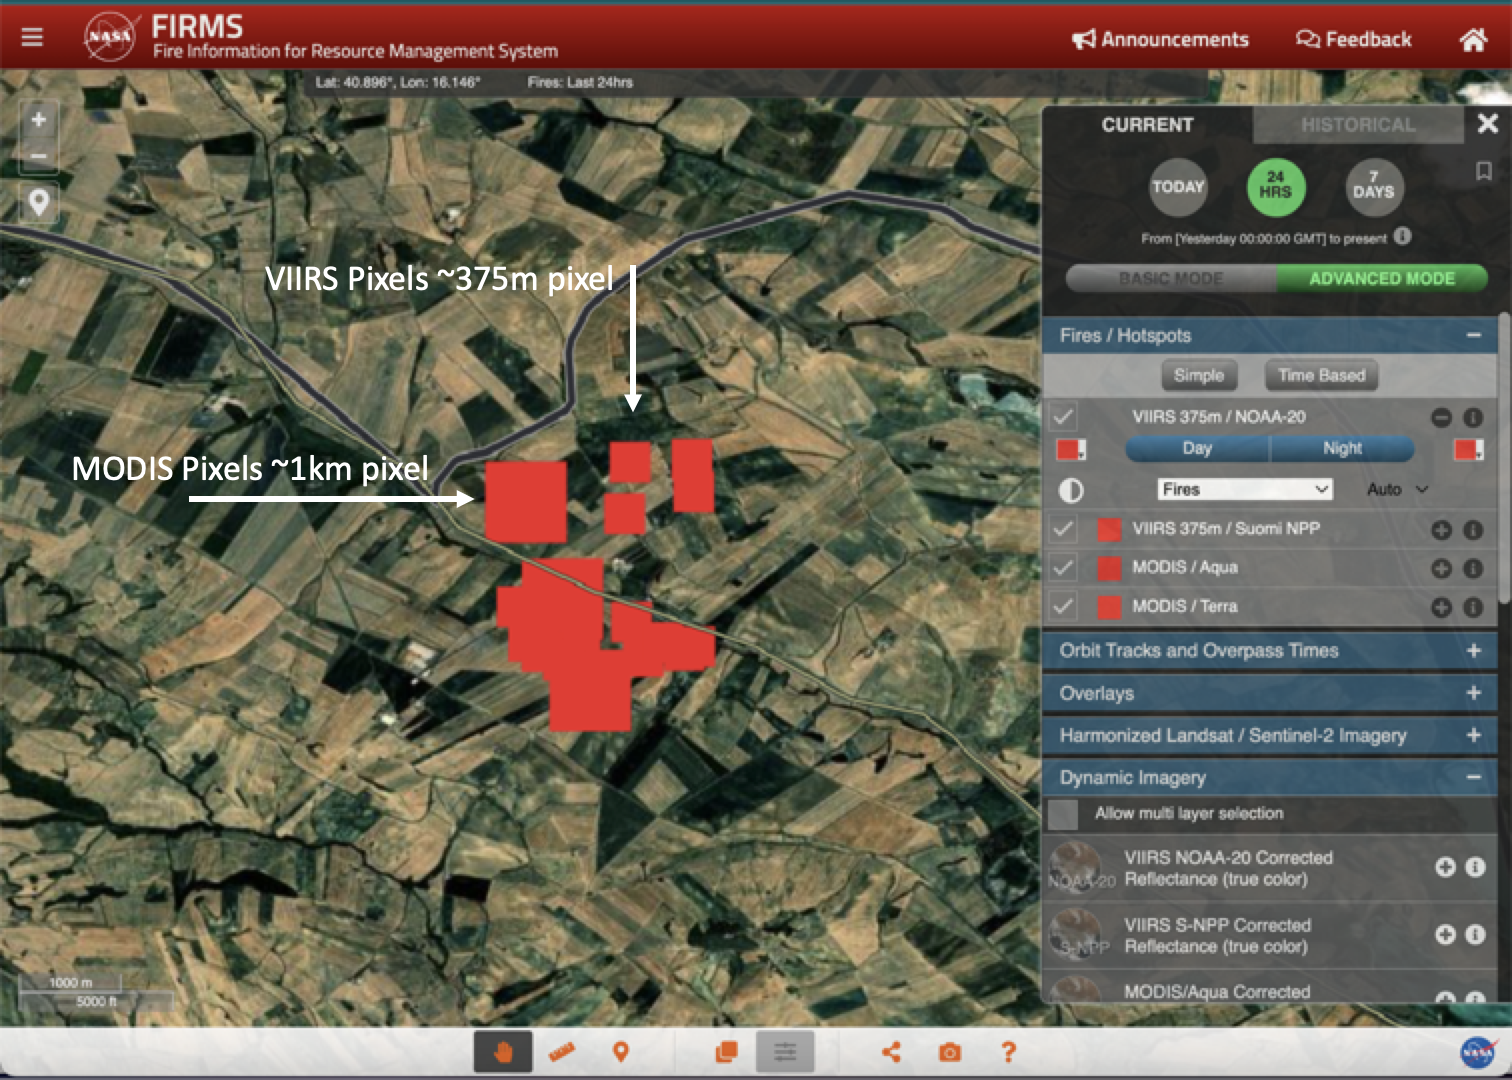
CHANGE FIRE PIXEL SIZE
The fire pixel size defaults to the optimal display for the zoom level. When zoomed into the highest zoom levels, MODIS pixels maintain a size of approximately 1km and VIIRS approximately 375m
To change the pixel size, make sure ADVANCED MODE is selected (as shown above). Click the "+" icon and then click the drop down arrow next to the word "Auto"
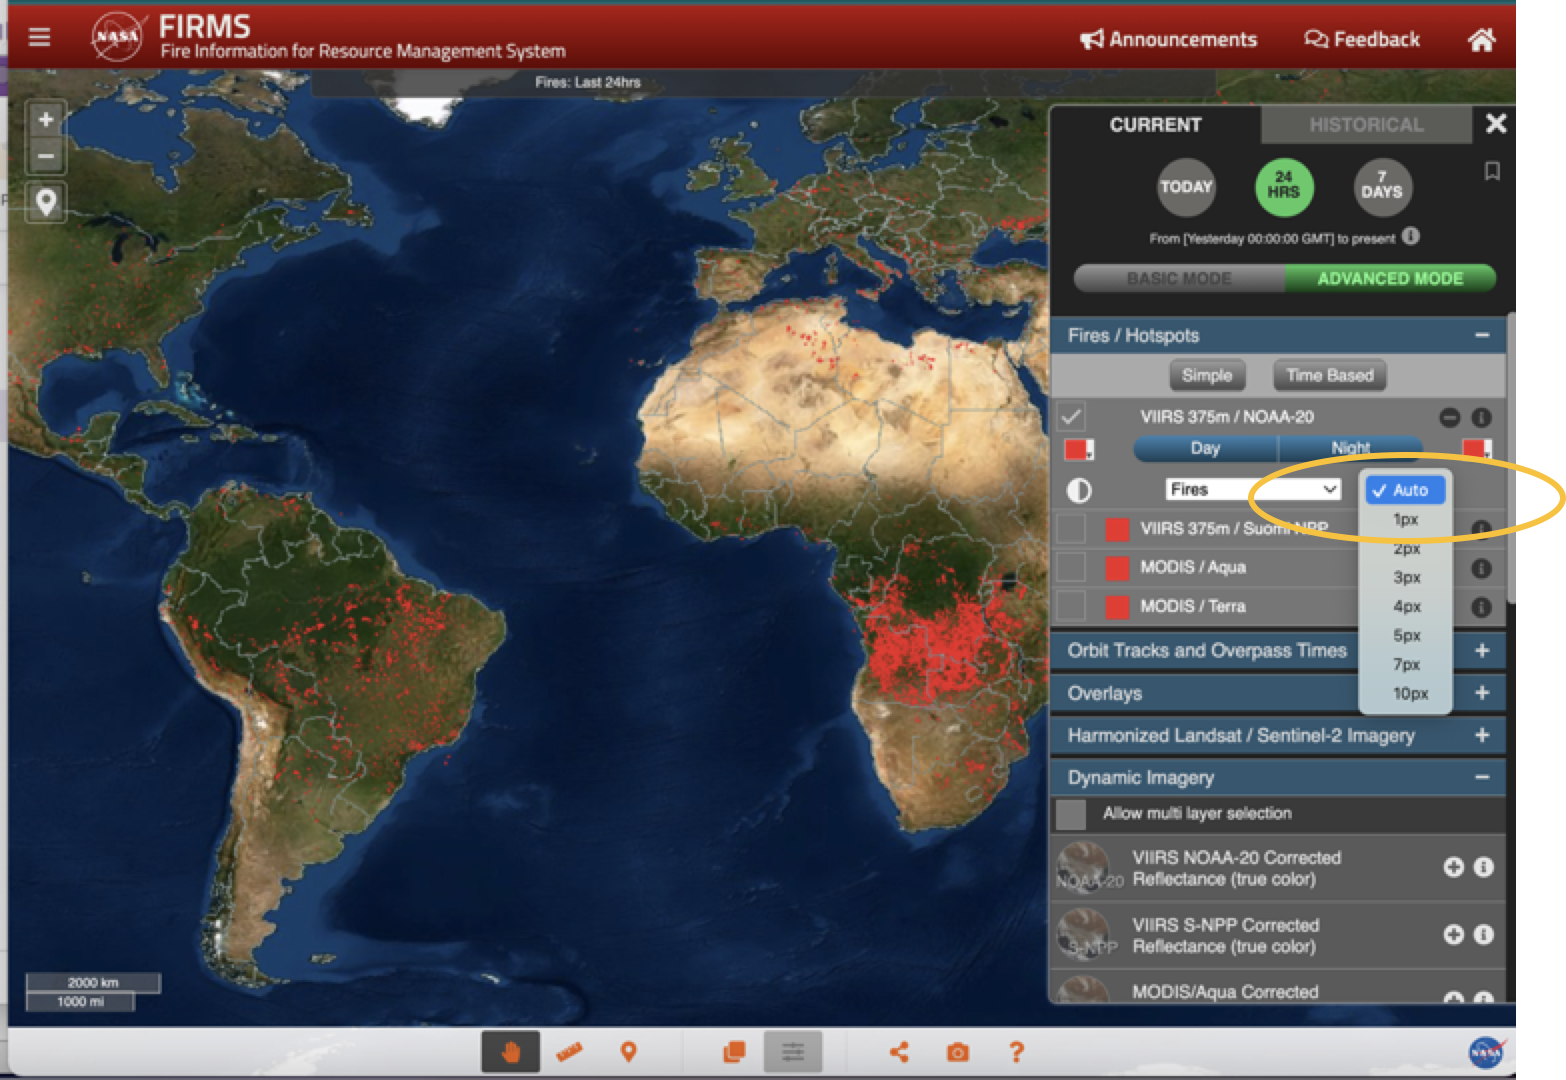
Adjust the pixel size from the drop down list
SHOW ONLY DAY / NIGHT FIRES
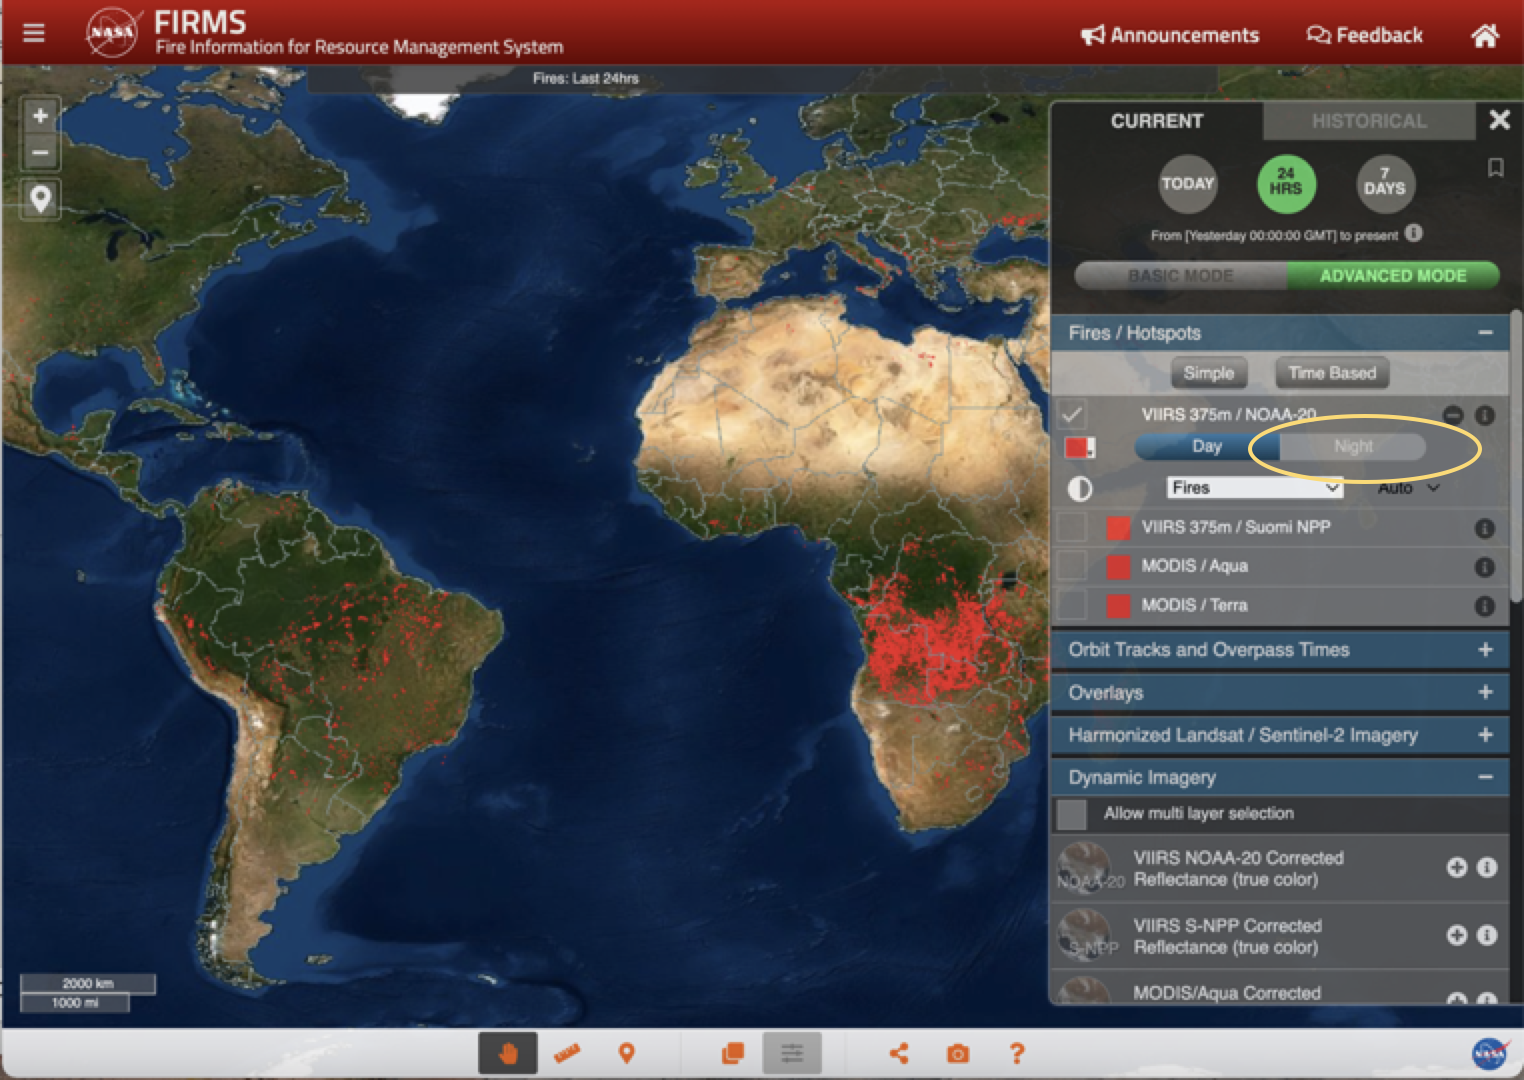
By default, the map shows both Day time and night time fires, to view only day time fires, may sure ADVANCED MODE is selected (as shown above). Click the "+" icon then click on "Night" to deselect it and it is greyed out. To view only nighttime fires, click on "Night" to turn both back on and then click on "Day" so it is greyed out.
VIEW FIRES BY FRP, CONFIDENCE or TIME SINCE DETECTION
To view fires using Fire Radiative Power (FRP), Confidence or Time Since Detection, select "ADVANCED MODE" in the Layer List, then select the drop down arrow next to the word "Fires" for the fire detections you want to change.
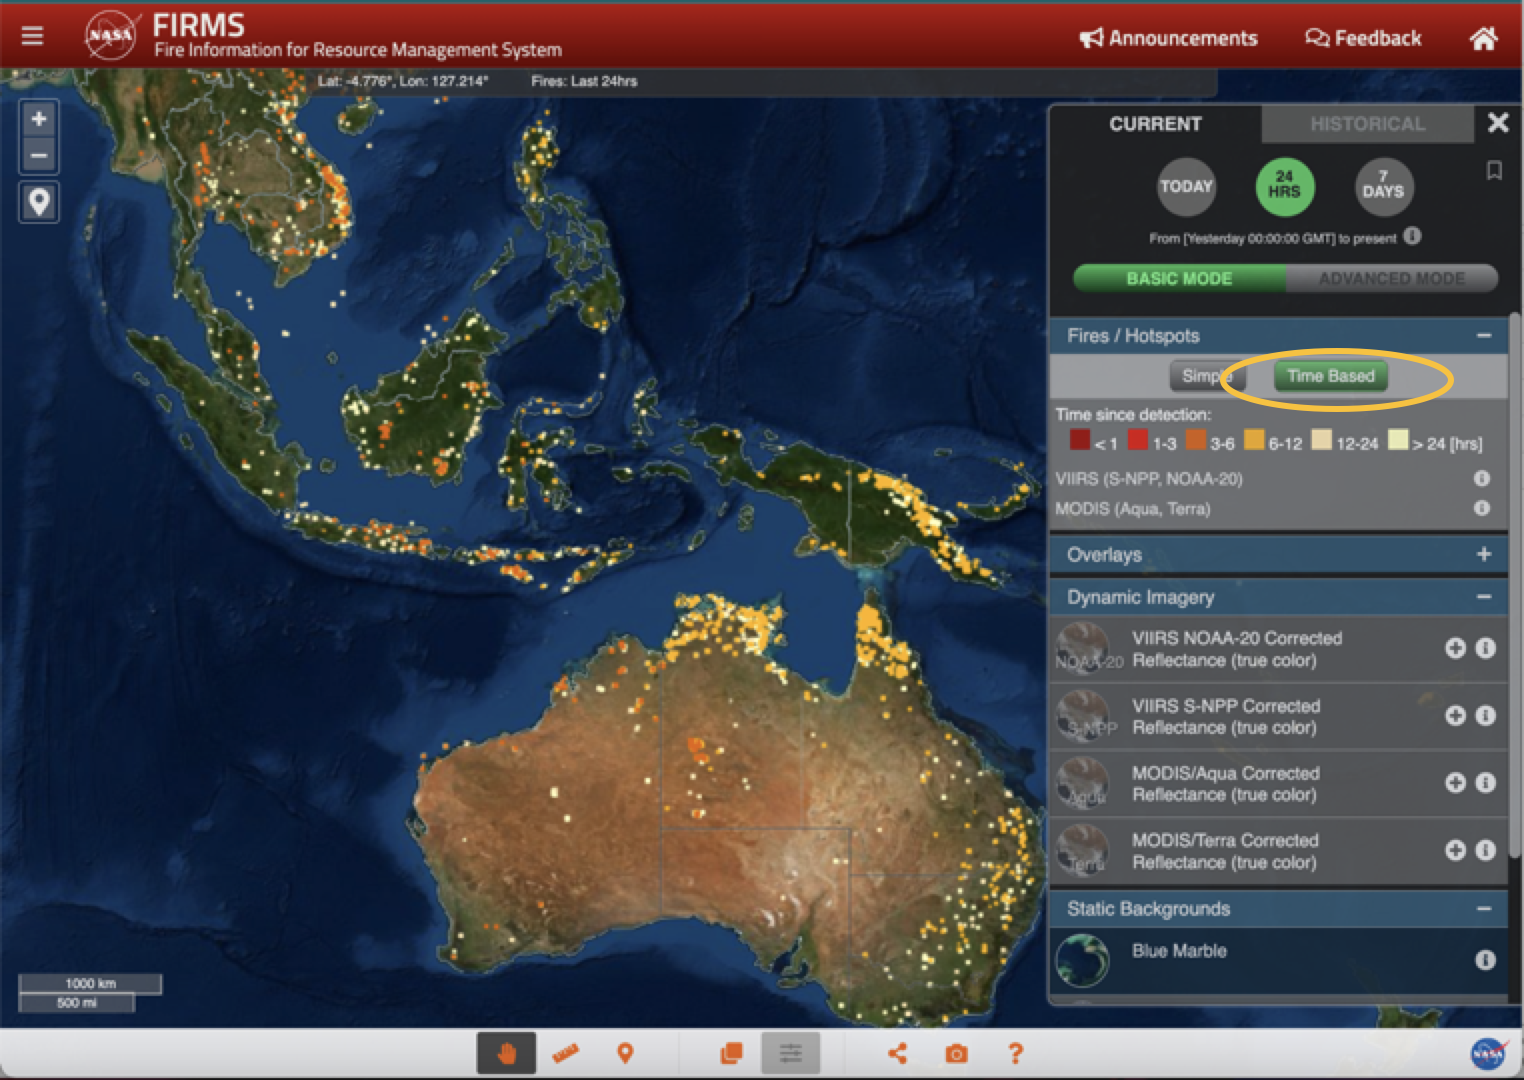
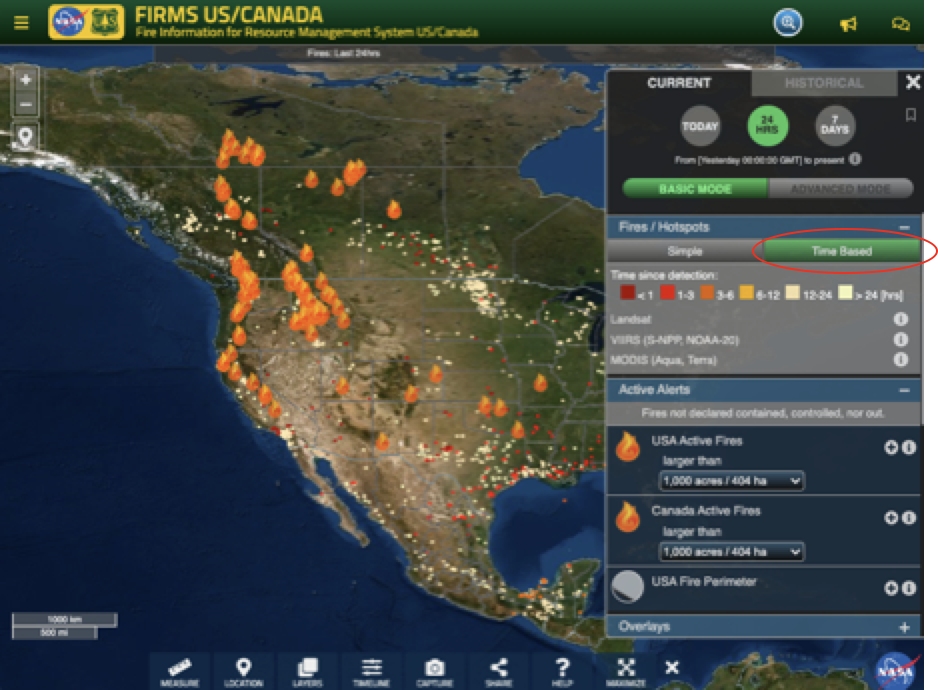
Time Since Detection shows the fires < 1, 1-3, 3-6, 6-12, 12-24, and >24 Hours since the fires were detected by the satellite. Enable this by selecting "Time Based" in either Basic or Advanced Mode.
FIRMS recently integrated ultra real-time (URT) MODIS and VIIRS active fire data, within a minute of satellite observation, from multiple direct readout ground stations in the continental US (CONUS).
See "FIRMS Adds Ultra Real-Time Data from MODIS and VIIRS" article on Earthdata.nasa.gov
This is the first routine service provided by FIRMS for detecting wildfires over the continental United States from NASA and NOAA low-Earth orbit satellites with a latency of less than 60 seconds from Earth observation to wildfire detection. The ultra real-time processing has been made possible by the Space Science and Engineering Center (SSEC) at the University of Wisconsin-Madison with funding from NASA's WildFireSense program. Software systems enable the SSEC to stream direct broadcast data in real-time from each antenna to a central collection point at the University of Wisconsin–Madison, which then ingests and merges the data, including de-duplication of overlapping data, in real-time.
Currently URT data are received from Madison, Wisconsin (2 antennas), Hampton, Virginia and Mayaguez, Puerto Rico. In addition to the URT, Real-Time (RT) data are received from Honolulu, Hawaii and Monterey, California (after the pass is complete). Latency for RT data is 20—30 minutes. It is anticipated that the real-time data will be expanded to include additional CONUS stations and stations in Alaska and Hawaii.
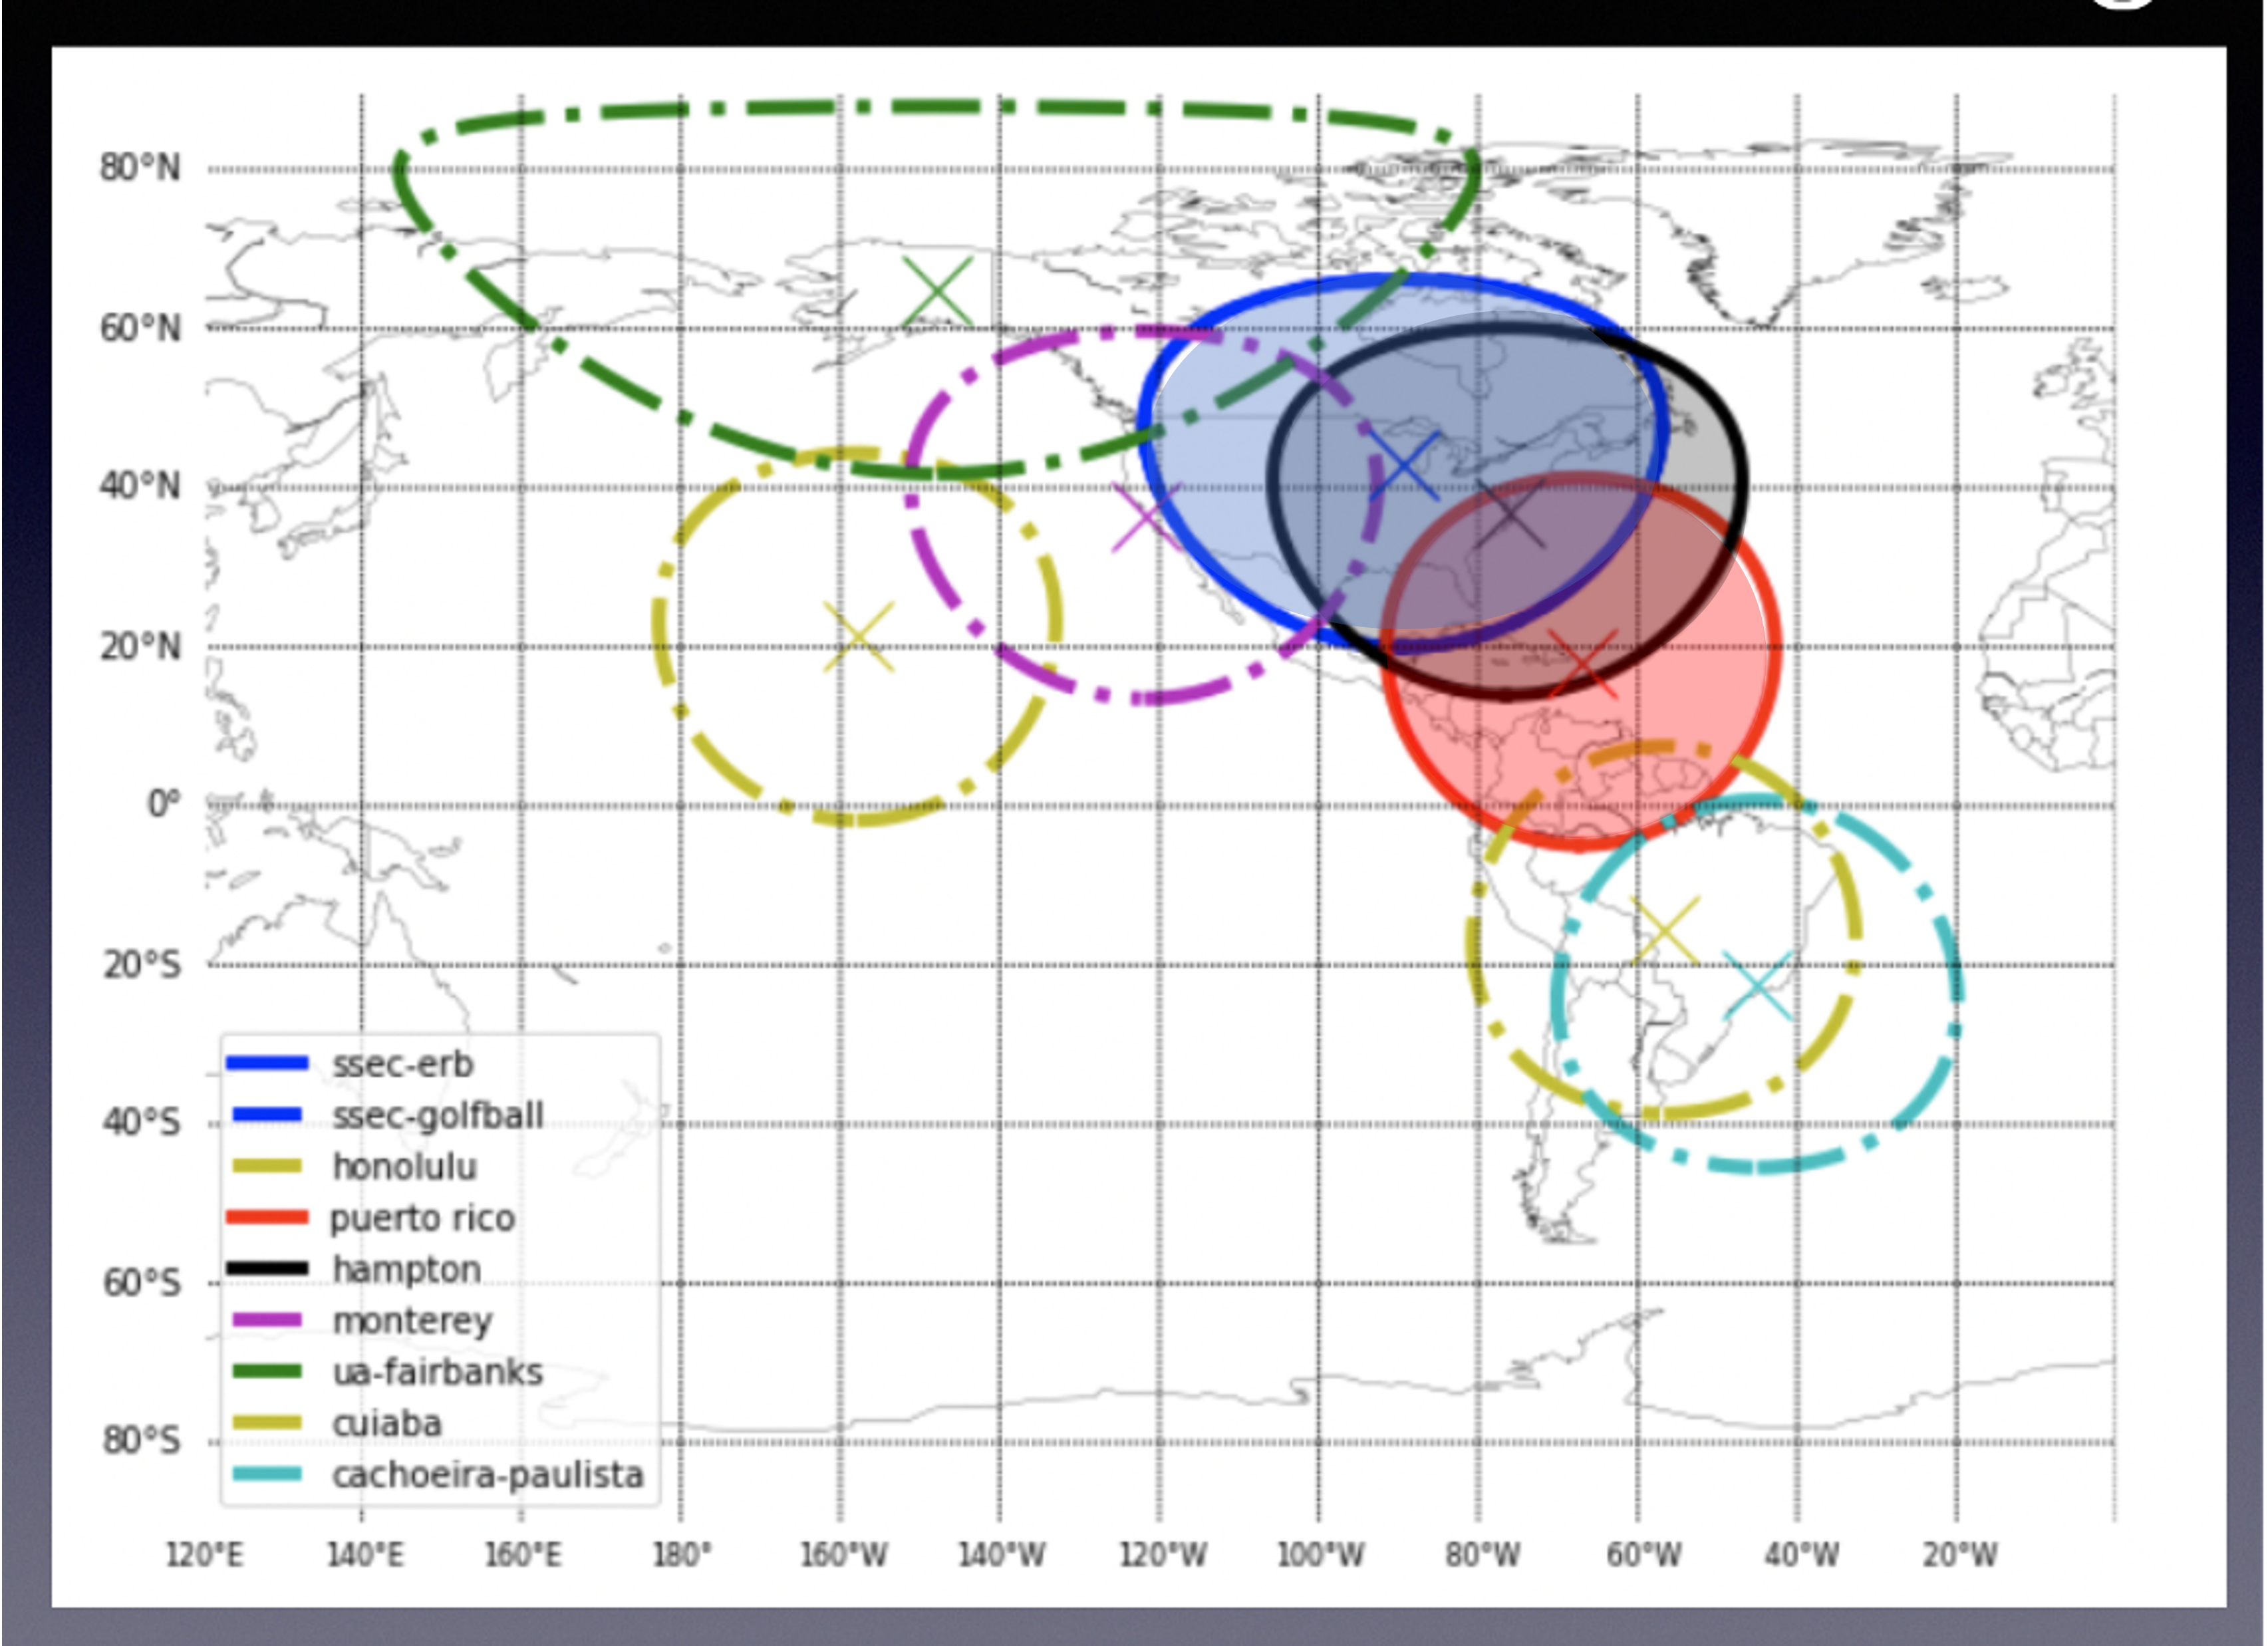
Figure showing current and planned coverage of Direct Broadcast
stations collecting ultra real-time and real-time data
URT and RT thermal anomaly / fire detections are processed using the LANCE FIRMS active fire algorithms, so the data are comparable with the NRT data from LANCE.
- URT and RT data are available in both FIRMS and FIRMS US/Canada Fire maps and can be identified by the URT or RT suffix in the "version" - found by clicking on the fires to view the attributes.
- URT and RT data are also available in the WMS and WFS map services and KMZs.
- URT and RT data will roll off the system within six hours as the NRT data becomes available.
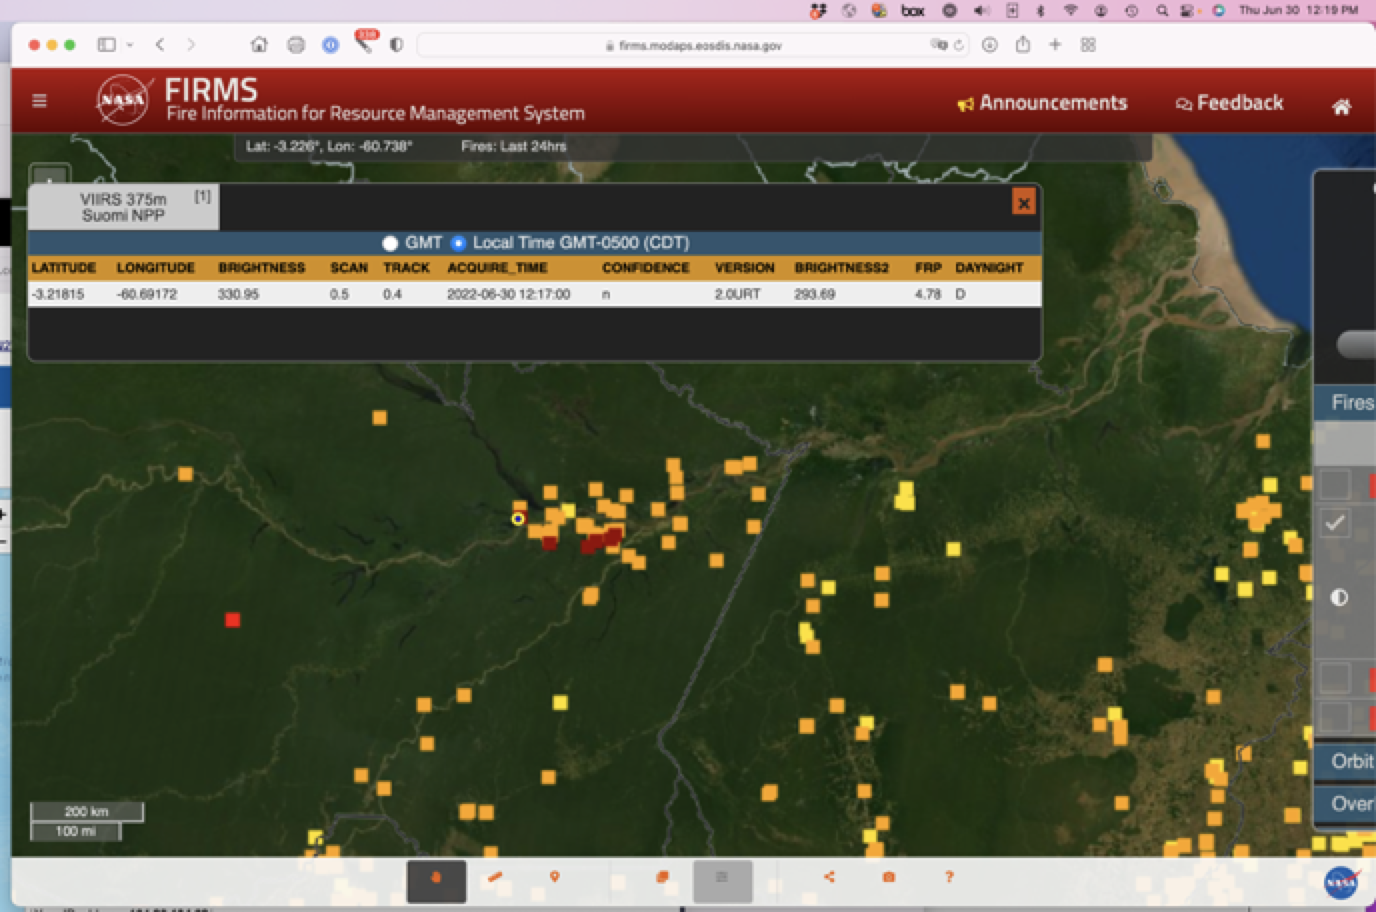
Screenshot showing URT fire detected on 2022/06/30.
The fire was observed at 12:17 CDT and displayed in FIRMS at 12:19 CDT
(as shown by computer time on top right of screen)
Users can see the real-time fire detections by selecting the Time Based option which color codes fires by Time Since Detection. However it is important to note that the URT and RT fires only show up within a minute of satellite fly-over so users need to know when the satellite passes overhead. To find our what time the satellite overpass is you can load the orbit tracks. (see next screenshot)
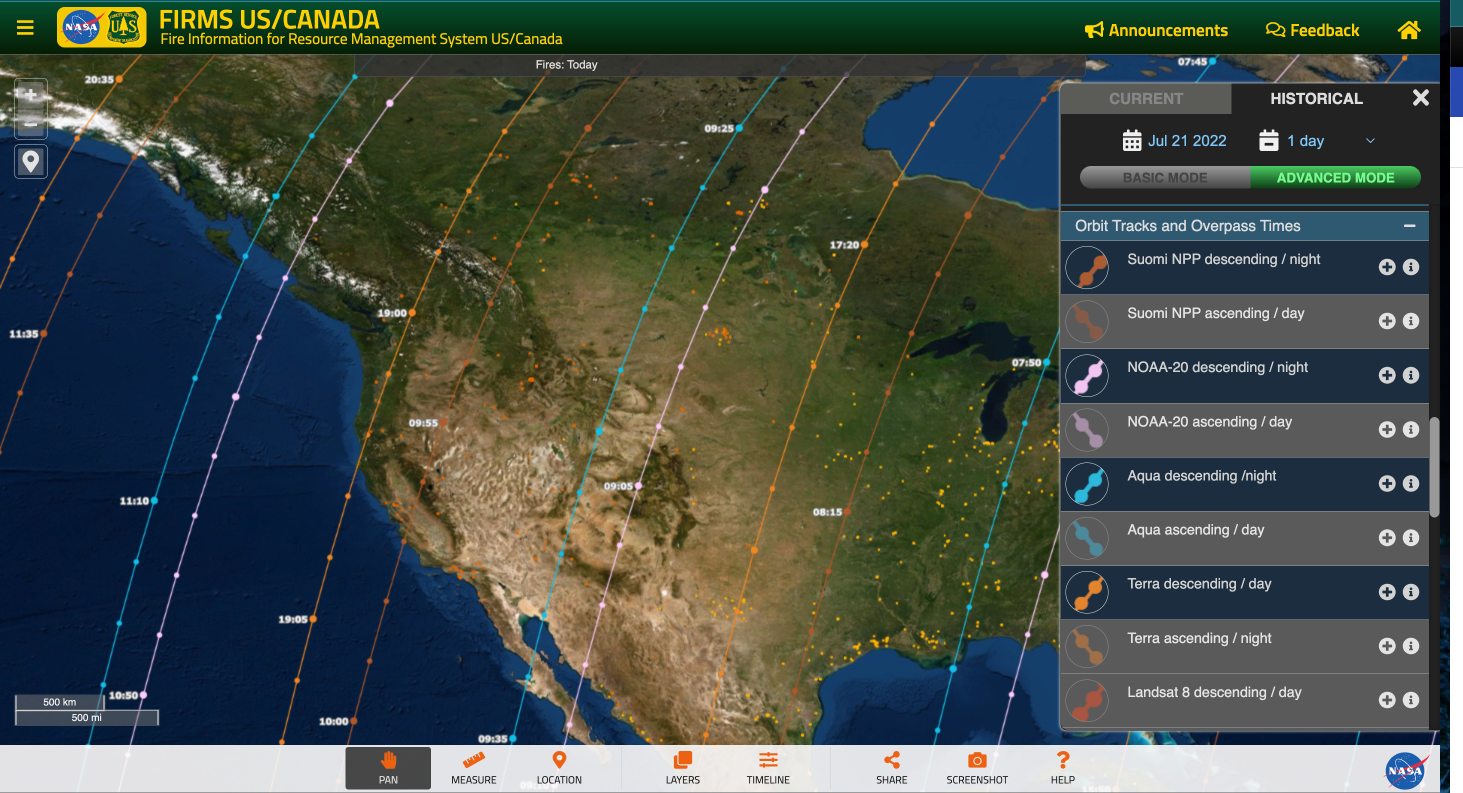
Screenshot showing descending overpass times from Suomi-NPP, NOAA-20, Aqua and Terra. These can be added by going to Advanced Mode and then selecting tracks from the Orbit Tracks and Overpass Times.
Once you have the Orbit tracks loaded, make sure the fires display using the "Time-Based" option and the look for the deep red colored squares.
FIRMS fire map users have always had the opportunity to compile a map view using desired layers and then capture a screenshot and save it as a JPG, PNG or GIF file to use or share. Users now have the option of capturing a FIRMS map view as a GeoTIFF image file. The GeoTIFF format includes spatial (georeferencing) information embedded in the .tif file so it can be integrated and viewed with other geospatial data. The GeoTIFF standard is in the public domain and can be readily imported and displayed in many GIS applications.
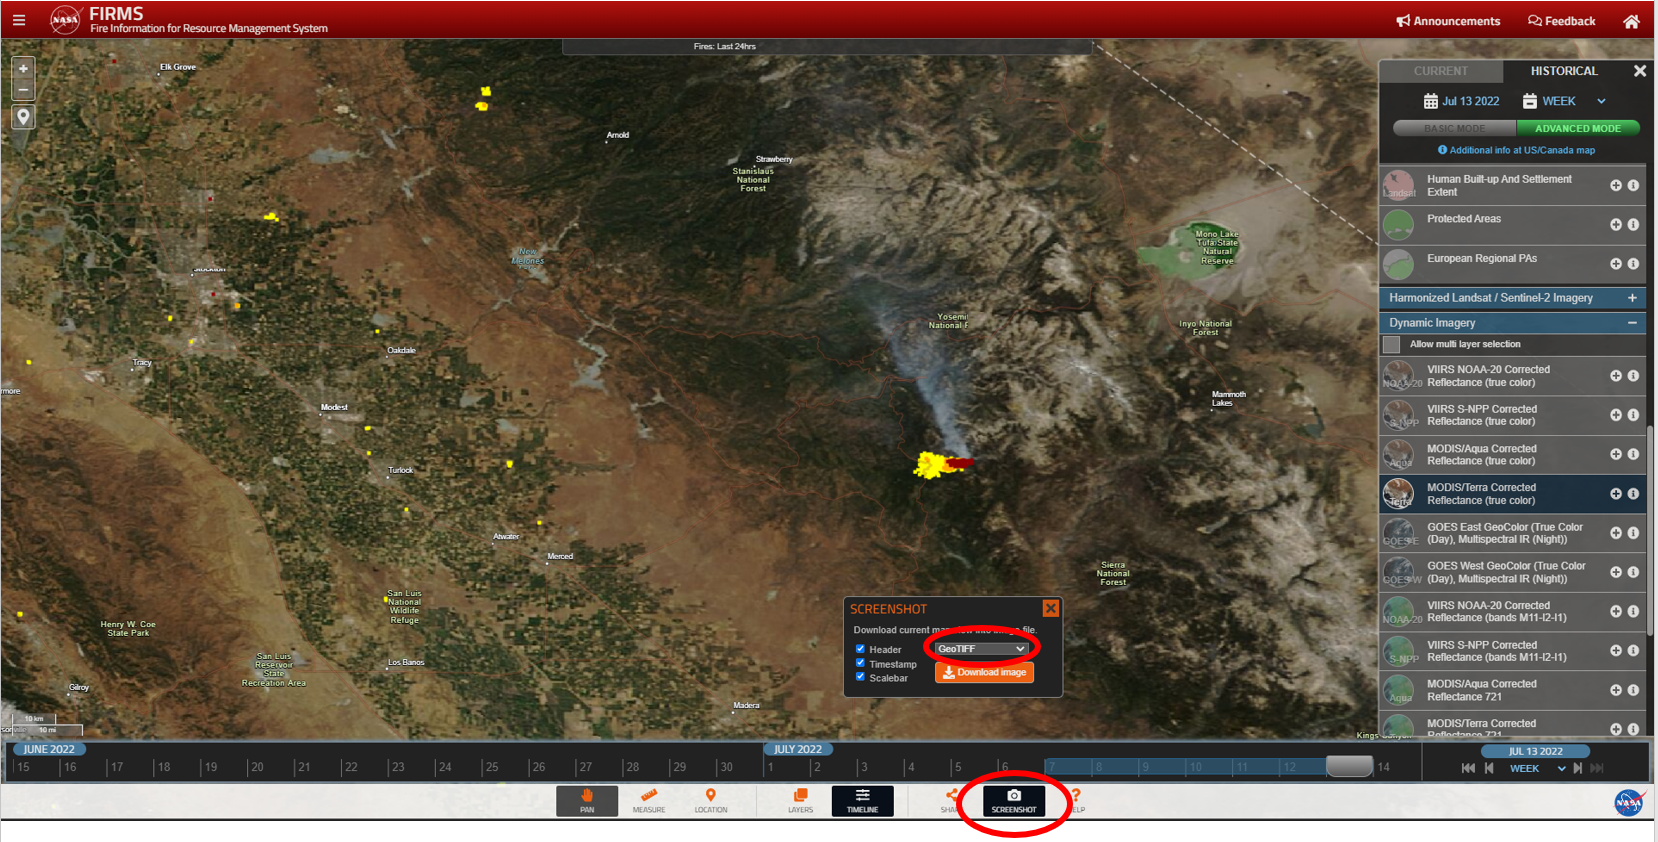
To create a GeoTIFF, click on the "screenshot" icon from the lower right of the FIRMS user interface and select "GeoTIFF" from the dropdown option in the screenshot window.