Blog from July, 2021
Viewing smoke in FIRMS using corrected reflectance imagery
Wildland fires can be a significant source of smoke that not only impairs our ability to enjoy clear vistas, but the gases and particulate matter it contains can be harmful to public health. When you see smoke in the sky it may be originating from a relatively local fire or a fire that is occurring several hundred miles away. True color composite imagery acquired by Terra MODIS, Aqua MODIS, S-NPP VIIRS or NOAA-20 VIIRS are provided as “Backgrounds” layers in FIRMS and FIRMS US/Canada Fire Maps. These layers display a "natural color image" of the Earth’s surface as it would look to the human eye from space. Consequently, it is easy to see smoke using this type of imagery in clear sky conditions. The time of observation for these four satellites occur at different times during the day, so they can be used to identify current sources of wildland fire smoke and visualize its transport across long distances. Use the Orbit Tracks and Overpass Times layers to determine the daily overpass time for each satellite.
Viewing smoke in FIRMS using aerosol indices
The standard Aerosol Index (AI) derived from S-NPP OMPS observations can also be used for identifying and tracking smoke as well as other aerosols. The OMPS Al, available as an “Overlays” layer in the FIRMS and FIRMS US/Canada Fire Maps, detects and measures the density of smoke and suspended particles in the vertical air column in the atmosphere. Typical values of the AI range from 0 to 5 and indicate dust storms or biomass burning smoke located in the lower troposphere (1-3 km). Values of 5.0 indicate heavy concentrations of aerosols that could reduce visibility or impact human health. For AI values significantly higher than 5 use the OMPS PyroCumuloNimbus, or pyroCb, AI layer. Larger pyroCb AI values between 5 and 10 usually indicate dense smoke from intensely burning fires that reach higher in the troposphere. Once the index gets above 10, the smoke has likely been produced from a pyroCb event, with dense smoke lofted into the upper troposphere and, often, into the stratosphere.
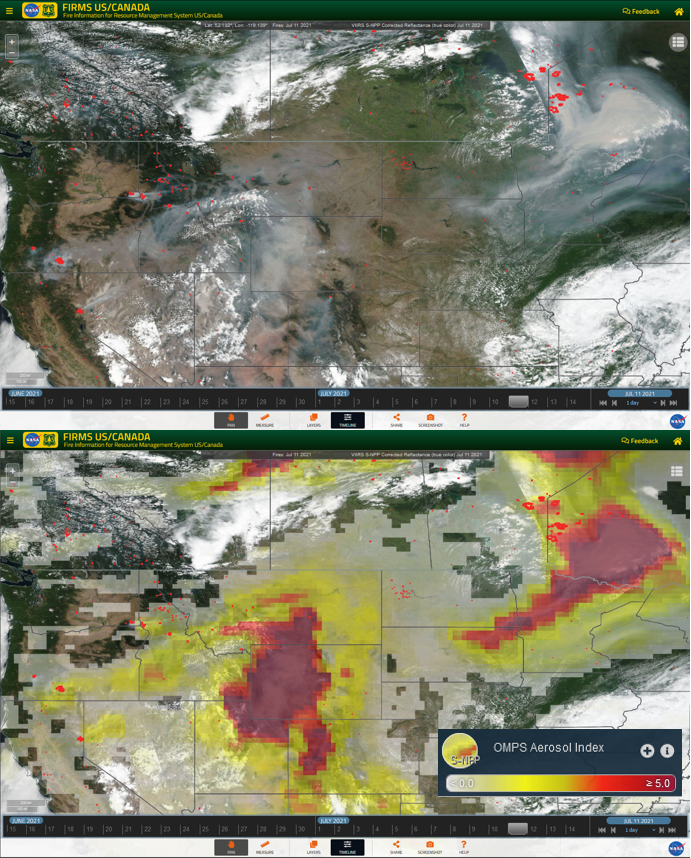 Wildland fire smoke visible in S-NPP VIIRS true color imagery acquired on July 11, 2021 (top). Active fire detections are displayed as red points. The aerosol index derived from S-NPP OMPS observations collected at the same time as the VIIRS imagery is provided for comparison (bottom). The high index values over Utah, Colorado, Wyoming and Montana indicate high concentrations of aerosols and are a result from fire activity in the Pacific Northwest and northern California. High aerosol index values in the eastern Dakotas, Minnesota and western Ontario are sourced from wildland fire activity in eastern Manitoba and western Ontario.
Get information and zoom to extent of wildland fires
The new FIRMS US/Canada fire map includes the location and details of wildland and prescribed fires. Locations of currently/recently active incidents larger than 100 acres (40.5 hectares) are displayed as fire icons when you open the US & Canada Fire Map. Click USA Active Fires and Canada Active Fires layers to toggle them off.
Click on a fire location to view the name, discovery date/time and current size of the fire. This information is routinely updated and maintained in systems of record managed by US and Canadian wildland fire management agencies. Clicking the View Situation Report link spawns a national situation report which may contain specific reporting information about the fire of interest. Additionally, by clicking the ZOOM TO LOCATION button, your map extent will automatically zoom to the extent of that fire.
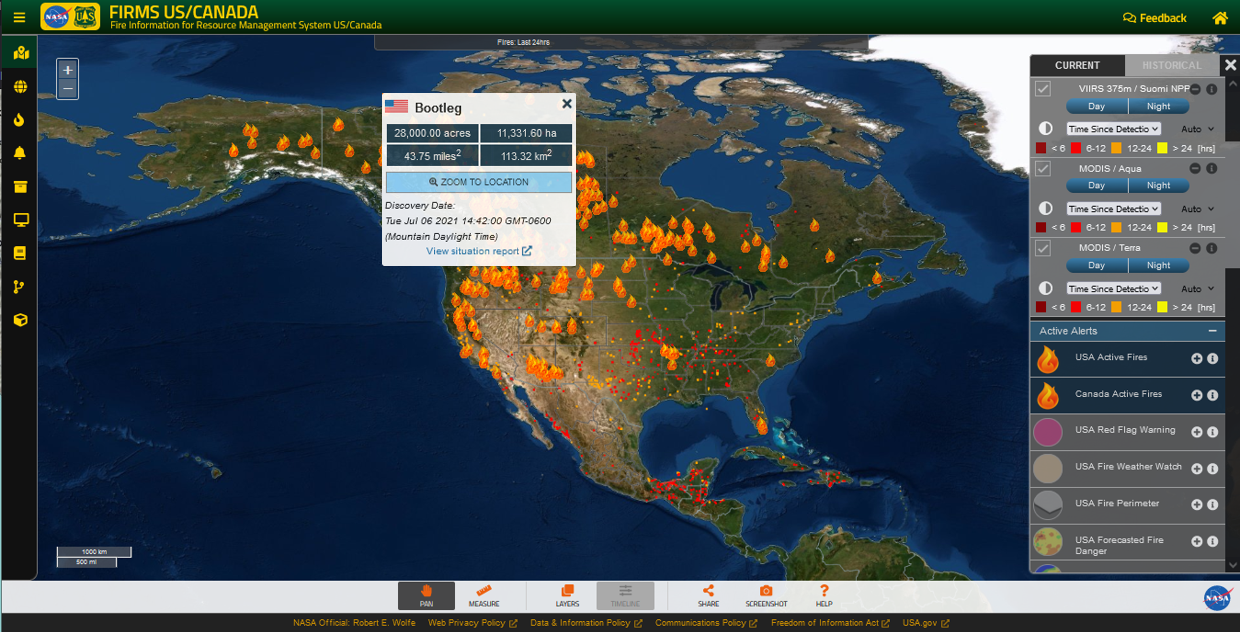 Clicking on a fire location provides information about the fire and the option to zoom to the map extent of the selected fire.
Perimeters for current US wildland fires
For wildland fires currently occurring in the US larger than 100 acres in size, fire perimeters are provided for context. These data are typically compiled by federal, state and local fire management agencies on a routine basis during the life of an incident, however, they may not be available for all incidents. These data are typically updated daily from multiple sources and indicate the current extent of the fire and containment lines. Click on USA Fire Perimeter layer to display the fire perimeter data in the FIRMS US/Canada Fire Map.
When using perimeters in the context of satellite active fire detection data, this can indicate where a fire is active within the perimeter and if it is growing outside of it. Additionally, if the fire perimeter is not fully covered by cumulative active fire detections, gaps in that coverage may indicate where the fire has grown in between observations by polar-orbiting satellite sensors like MODIS and VIIRS, cloud cover at the time of satellite overpass occluded observations when the fire was actively burning, or fire activity was smaller and/or less intense at the time of satellite overpass or was not detectable under the vegetation canopy. Isolated active fire detection pixels outside of the perimeter can be indicative of detections occuring towards the edge of a swath which results geolocational errors due to the increasingly distorted field of view in the scan track direction, particularly for MODIS.
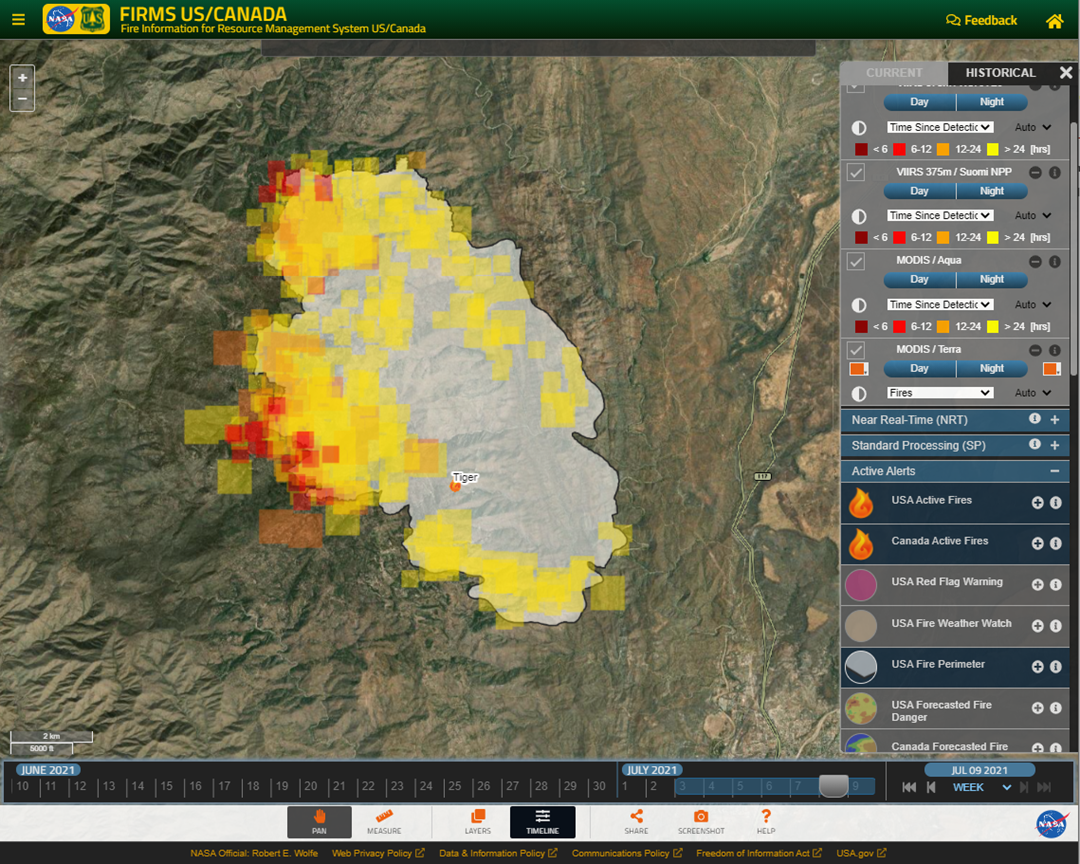 Visualization of MODIS and VIIRS active fire detection data in the context of a current perimeter for a wildland fire.