Blog
search
attachments
weblink
advanced
Overview
Content Tools
Worldview Release 3.7.0 includes lots of new goodies!
- Layer Picker: Layer descriptions are more easily discovered, we've added more search functionality with options to filter the layers by different facets such as by temporal period, category, measurements, whether the imagery was obtained during the daytime or nighttime, and many more.
- Timeline Availability Panel: Visually determine whether layers you have loaded have temporally coincident imagery using the timeline availability panel.
- Distraction free mode: Too much stuff on top of the map? Click on the "i" button to turn on distraction free mode and get rid the Layer List, Timeline, Measurement Tool and other buttons so you can concentrate solely on the imagery!
- Vector capabilities: We've adding the ability to interact with vector layers such as Settlements, Dams, Reservoirs and Nuclear Power Plants. You can now zoom in and query a point or polygon for these layers to find out more about them. The settlements layer provides settlement name, estimated population in 2000, and whether the settlement is urban or rural. More to come in forthcoming releases...fire/thermal anomalies layers next!
For more information, read this short article on the Earthdata website: New Imagery and Functionality Available in NASA Worldview.
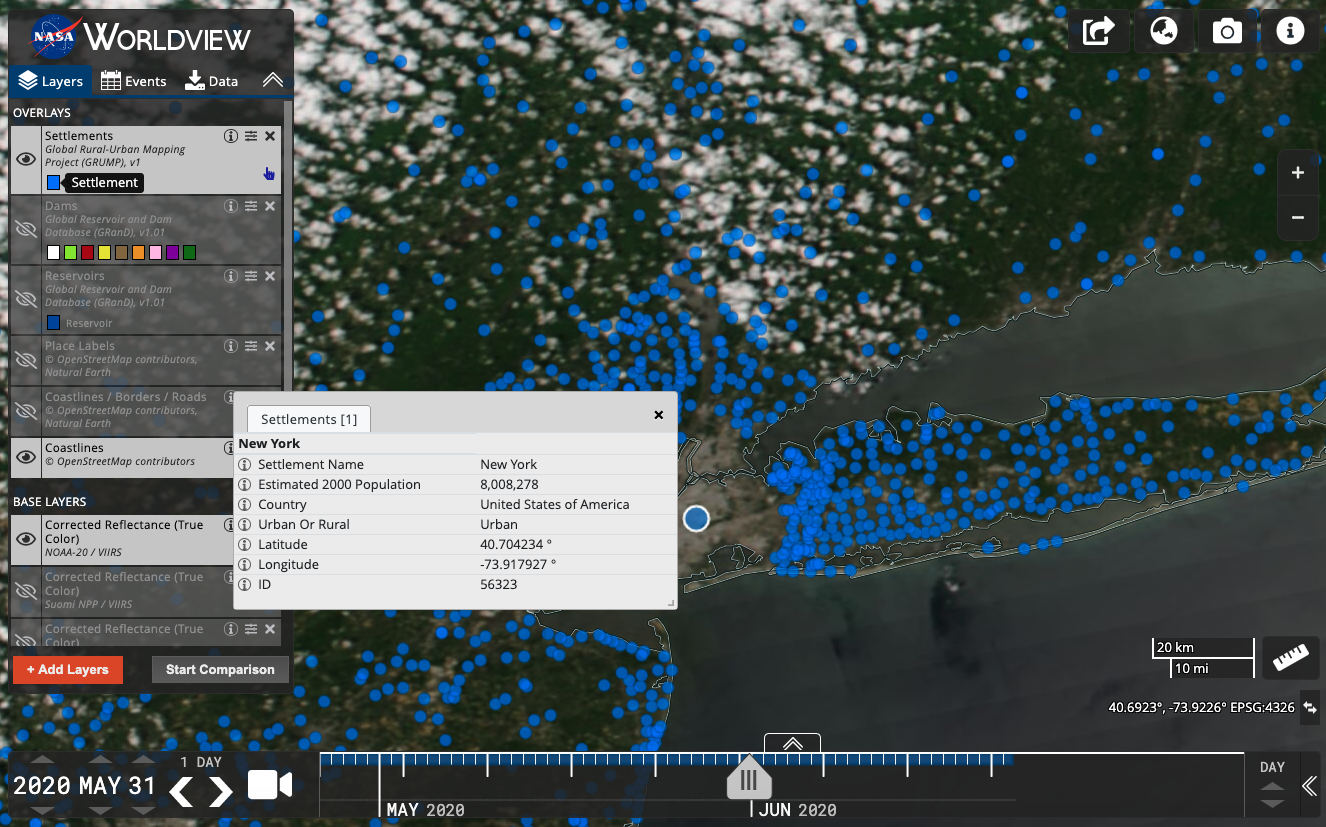
Interacting with the Settlements vector layer brings up more detailed information.
We've added quite a few new imagery layers into GIBS and the latest version (3.7.0) of Worldview - a total of 35 new layers!
NOAA-20/Visible Infrared Imaging Radiometer Suite (VIIRS) (5 Daily layers)
- True color Corrected Reflectance
- False color (Bands M3-I3-M11) Corrected Reflectance - this band combination is good for identifying snow and ice.
- False color (Bands M11-I2-I1) Corrected Reflectance - this band combination good for identifying burn scars and flood waters.
- Brightness Temperature (Day and Night)
This means that we now have 4 sets of similar imagery from 4 different satellite/sensor combinations! This is useful for cross comparison and for continuity for when older missions retire.
Suomi NPP/Visible Infrared Imaging Radiometer Suite (VIIRS) (4 Daily layers)
- Chlorophyll a
- Sea Surface Temperature (Day and Night)
- Photosynthetically Available Radiation
Aqua and Terra/Moderate Resolution Imaging Spectroradiometer (MODIS) (8 Daily layers)
- Chlorophyll a - Terra and Aqua
- Sea Surface Temperature (Day) - Terra and Aqua; (Night) - Terra and Aqua
- Photosynthetically Active Radiation - Terra and Aqua
Group for High Resolution Sea Surface Temperature (GHRSST) (7 Daily layers)
- Sea Surface Temperature (GAMSSA GDS2, MUR25)
- Sea Surface Temperature Anomalies (MUR, MUR25)
- Sea Ice Concentration (GAMSSA GDS2, MUR, MUR25)
MEaSUREs (1 5-Day layer)
GCOM-W1/Advanced Microwave Scanning Radiometer 2 (AMSR2) - Unified algorithm (10 Daily layers)
- Wind Speed (Day and Night)
- Total Precipitable Water (Day and Night)
- Surface Precipitation (Day and Night)
- Columnar Cloud Liquid Water (Day and Night)
- Columnar Water Vapor (Day and Night)
The unified algorithm layers will replace the existing AMSR2 layers as the older imagery is processed.

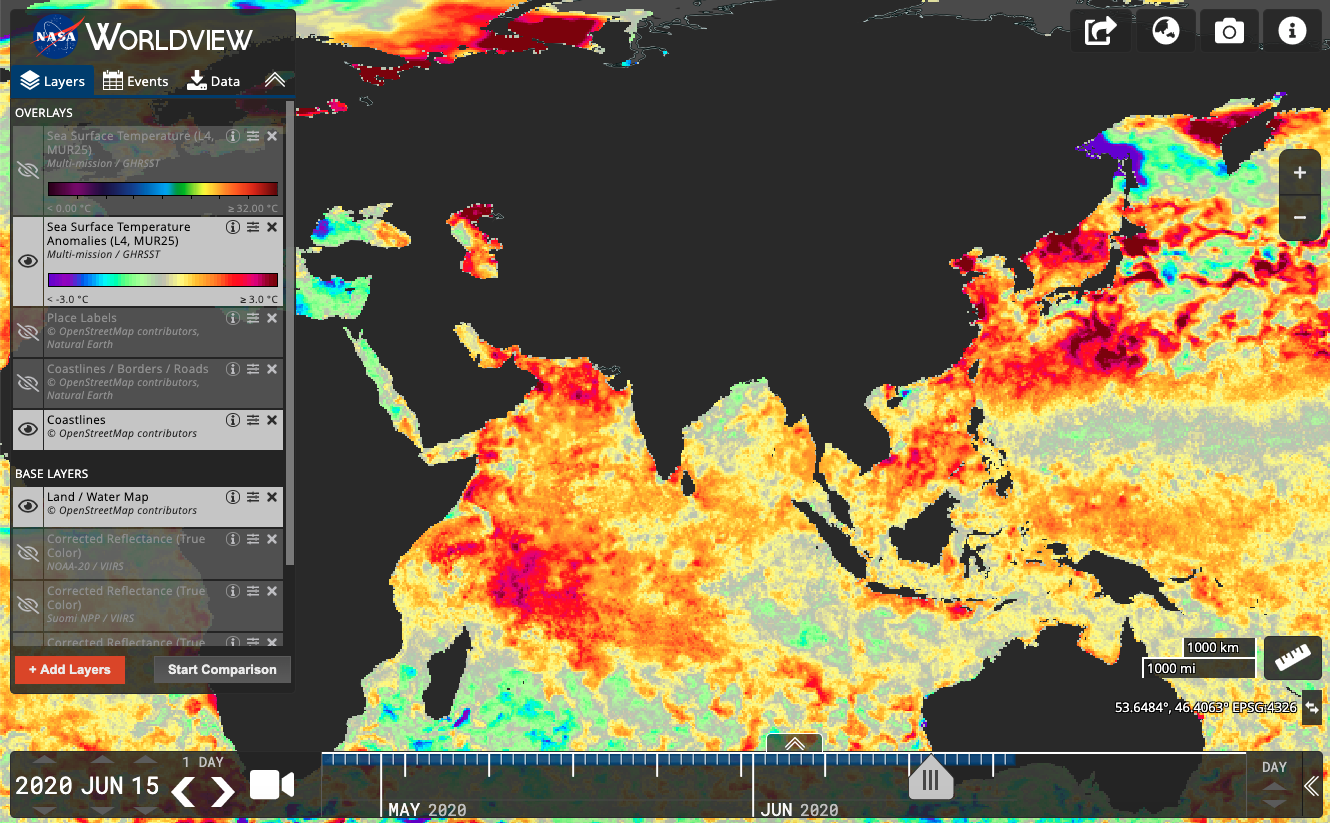
Sea Surface Temperature (MUR25) at the top and Sea Surface Temperature Anomalies (MUR25) at the bottom from GHRSST.
Please complete NASA's Land Atmosphere Near real-time Capability for EOS (LANCE) Customer Satisfaction Survey if you would like to provide feedback on NASA's near real-time data and imagery distributed through LANCE, Worldview Worldview Snapshots, the Global Imagery Browse Services (GIBS) and/or Fire Information for Resource Management System (FIRMS).
We released a new version of NASA Worldview, version 3.5.0, yesterday and wanted to share the good news with you!
Read the short article on the Earthdata website, Layer by Layer, NASA Worldview Continues to Improve, to learn more about our most recent improvements or just go and visit NASA Worldview to see the new changes!
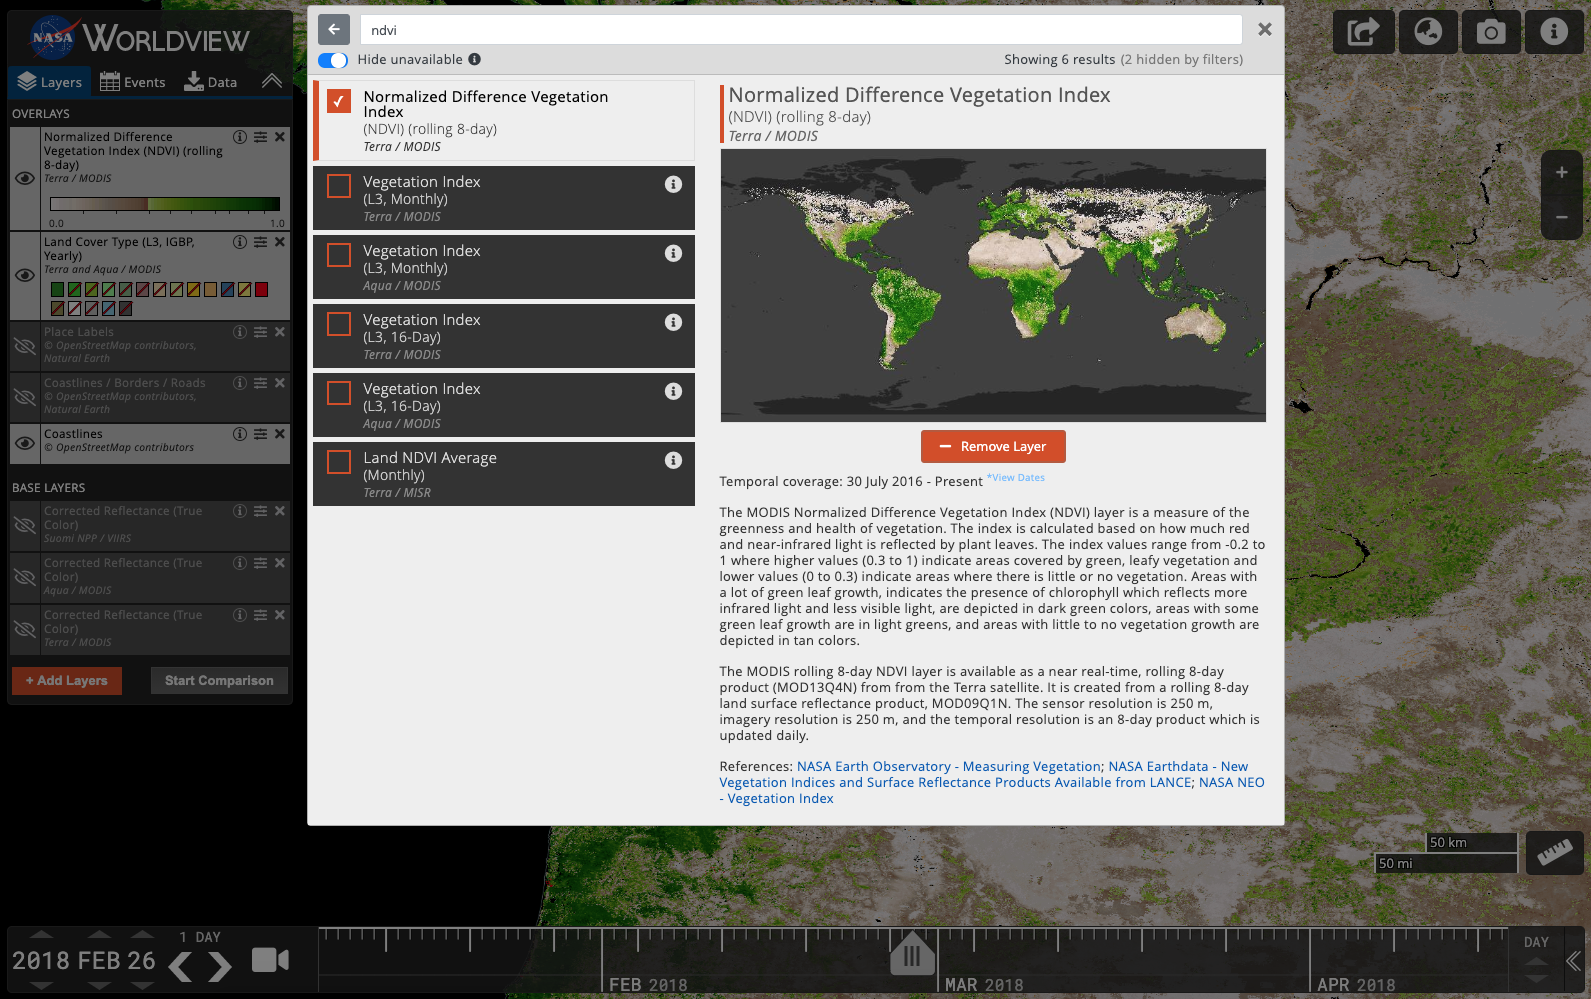
New features include a preview image and layer description when a layer search is conducted.
In this release, we have also added a new set of Fires and Thermal Anomalies layers (Day and Night) from the Visible Infrared Imaging Radiometer Suite (VIIRS) on board the NOAA-20 (aka JPSS-1) satellite. This satellite crosses the equator 50 minutes prior to the Suomi National Polar orbiting Partnership (Suomi NPP) satellite, at approximately 12:40 PM (ascending/day node) and 12:40 AM (descending/night node). This means we now have four sets of Fires and Thermal Anomalies (Day and Night) layers - MODIS/Terra, MODIS/Aqua, VIIRS/Suomi NPP, and VIIRS/NOAA-20! Explore the Fires and Thermal Anomalies layer from VIIRS/NOAA-20 in NASA Worldview!
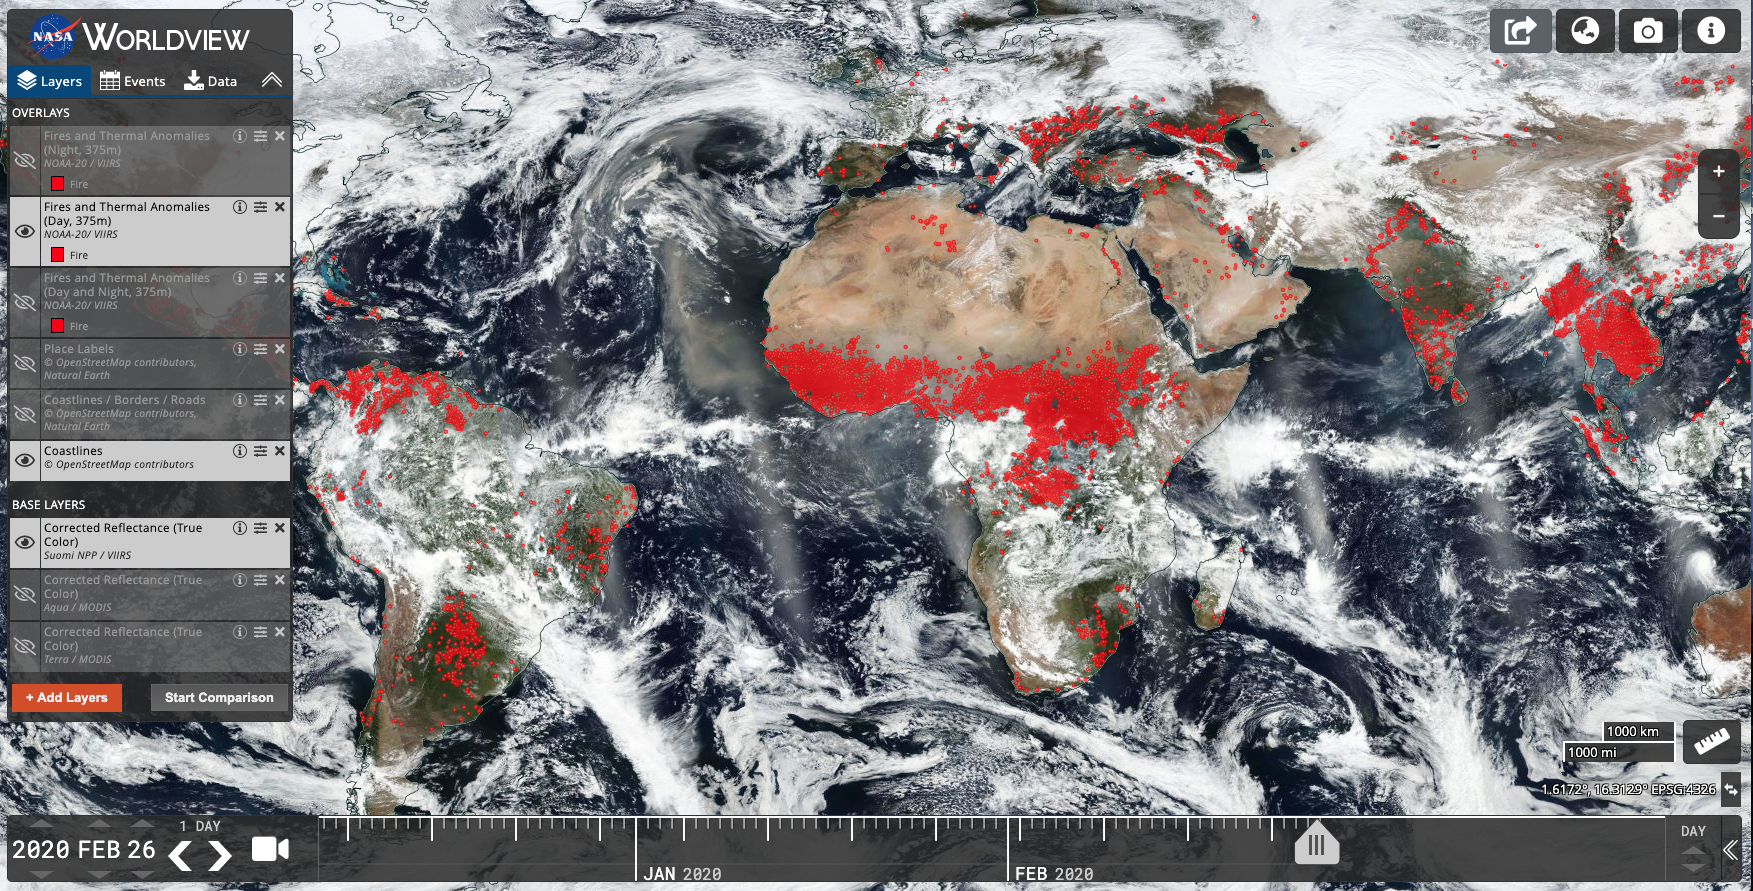
VIIRS/NOAA-20 Fires and Thermal Anomalies layers now available in Worldview.
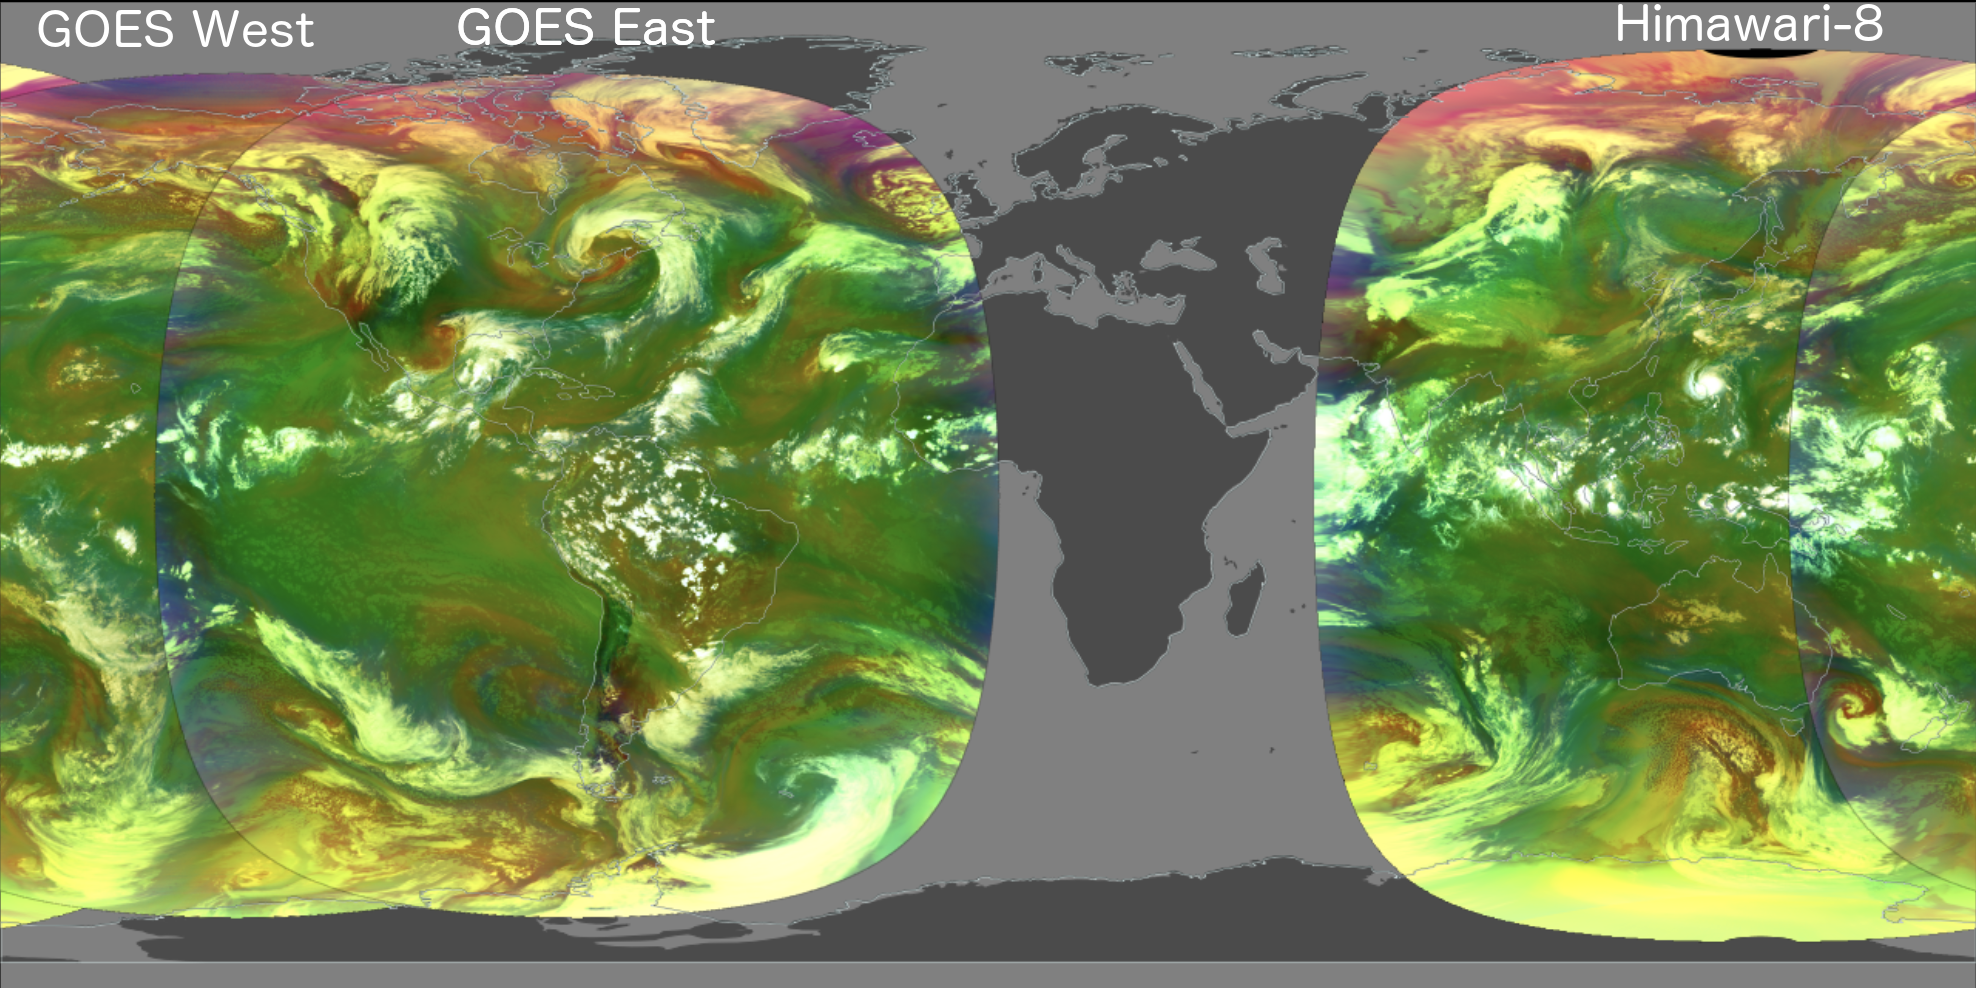
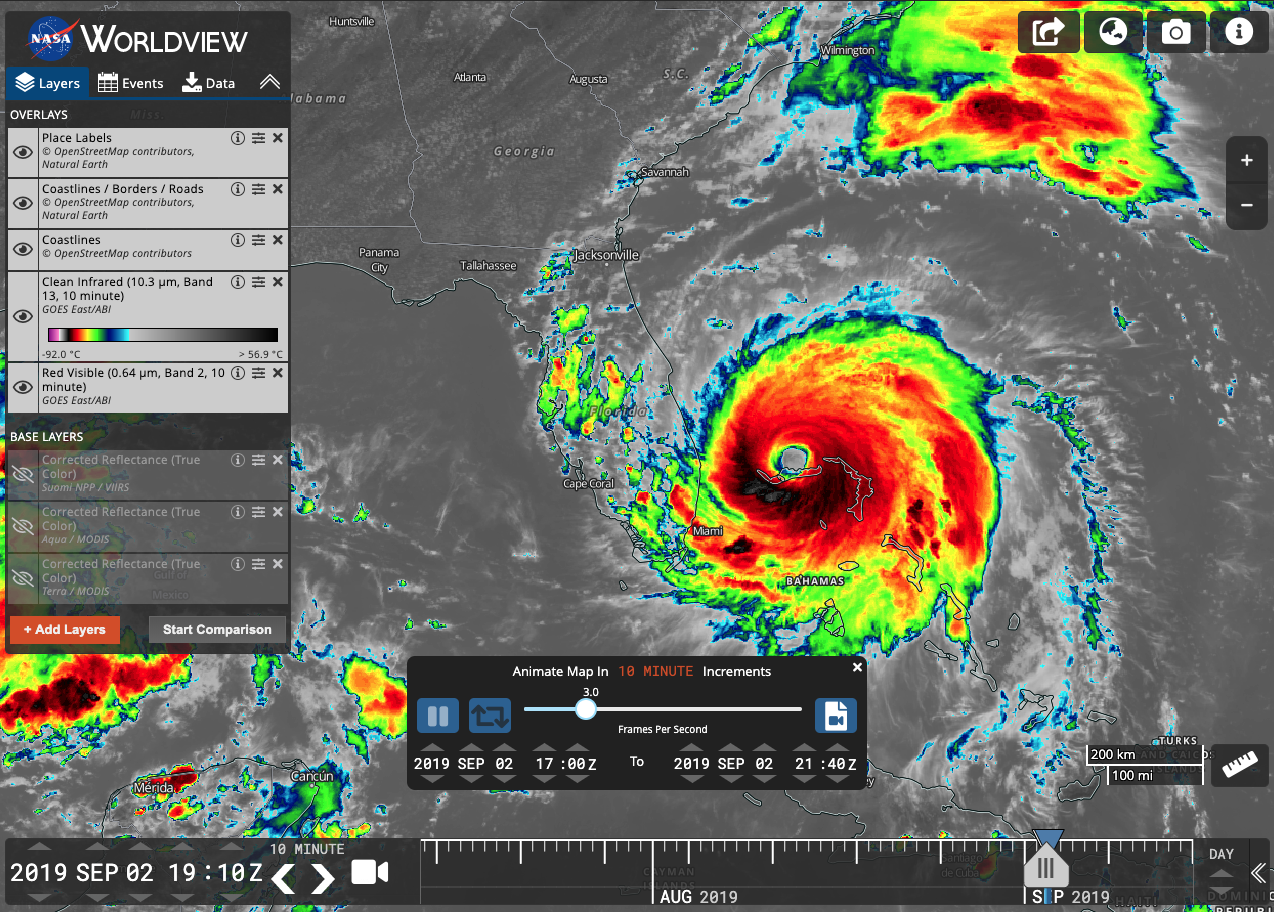
We've been faithfully providing daily global imagery from MODIS, VIIRS, and other instruments for the last 7+ years and we're now entering new territory - we're going to provide a rolling month of geostationary imagery from GOES-East, GOES-West and Himawari-8.
That's imagery available at 10 MINUTE increments for the last month!
Our current offerings will be Red Visible, Clean Infrared and Air Mass. We may add more in the future, or provide higher resolution versions of this imagery - keep an eye on the blog for any updates! In particular, the Red Visible layer is currently being displayed at 1km spatial resolution but may be available at its native 500m in the future.
See Geostationary Imagery in Action
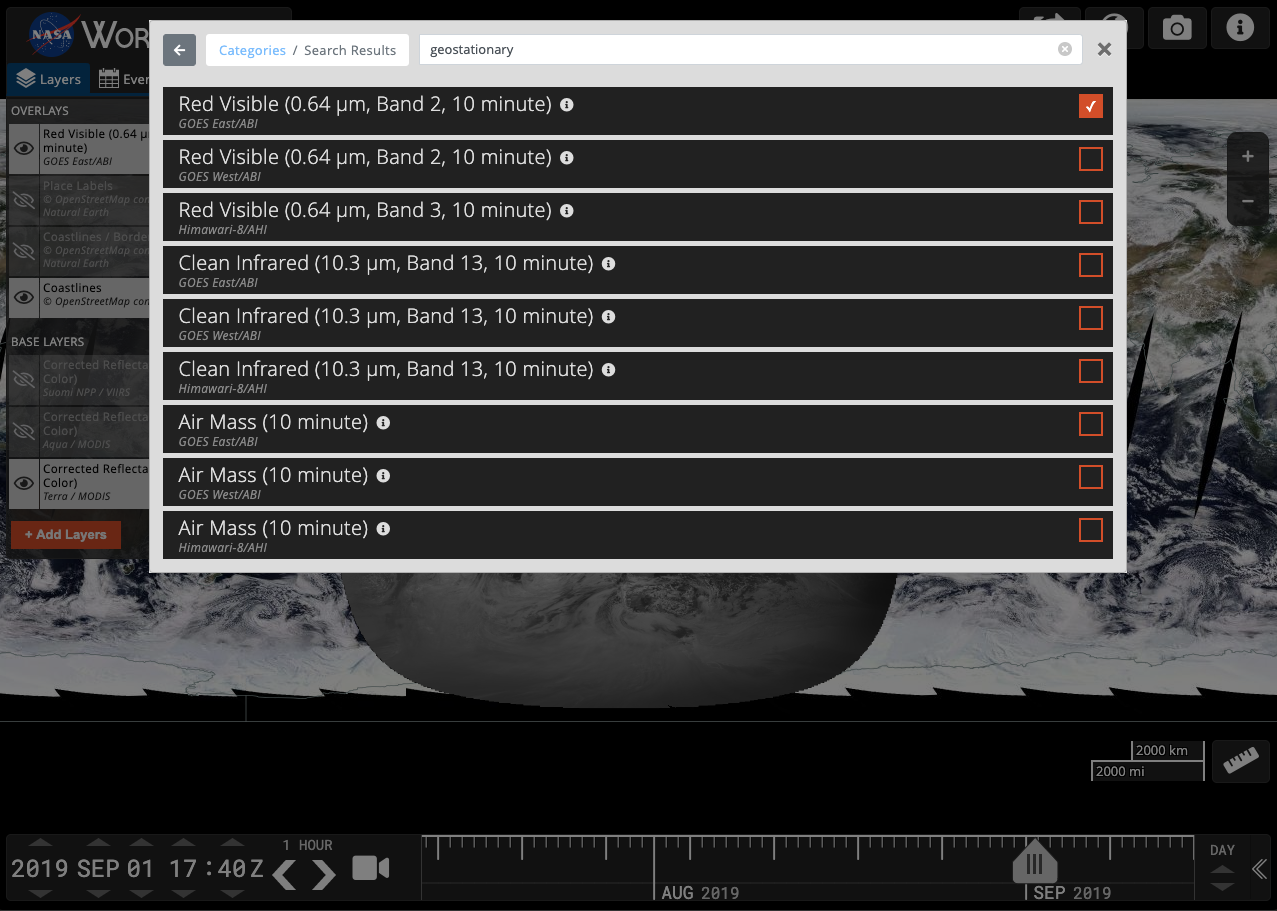
Step 1: Load Geostationary Imagery
Open Worldview's latest release (v.3.2.0): https://worldview.earthdata.nasa.gov
- Click on "+ Add Layers" button at the bottom of the Layer List.
- Select the "Featured" tab and select "Geostationary"; alternatively, type in "Geostationary" in the search box.
- Select one of the available layers such as "Red Visible (0.64um, Band 2, 10 minute) GOES East/ABI".
 GOES East/ABI Full Disk loaded in Worldview")
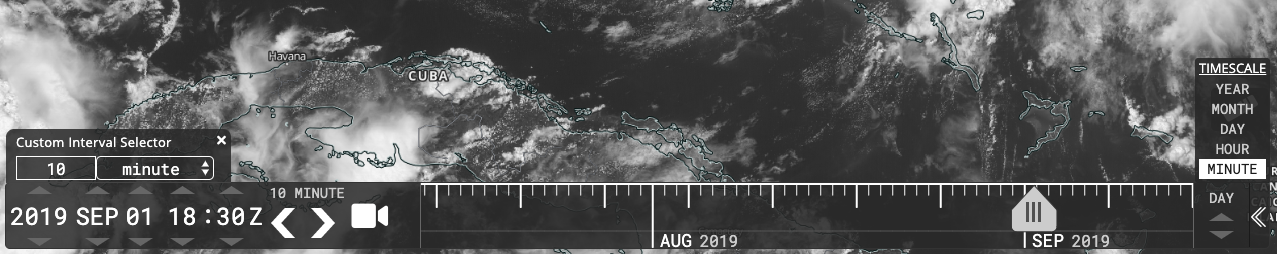
Step 2: Set Up Timeline
- Note the change in the timeline! You can now see the Year, Month, Day AND the time in Hours and Minutes Z (Zulu Time which is equivalent to UTC - Coordinated Universal Time) on the left side of the timeline.
- To the right of the "Z" are the < > increment arrows. Click on "1 Day" above these to change the increment. There are several options - Year, Month, Day, Hour, Minute and Custom. Click on Custom and in the Custom Interval Selector box, change the increment to "10" and "Minute". (This imagery is available in 10 minute increments starting at 00:00)
- Click on "Day" on the right side of the timeline to change the timescale to "Minute" or "Hour".
TIP: The geostationary imagery from GOES-East, GOES-West and Himawari-8 is available in 10 minute increments starting at 00:00.
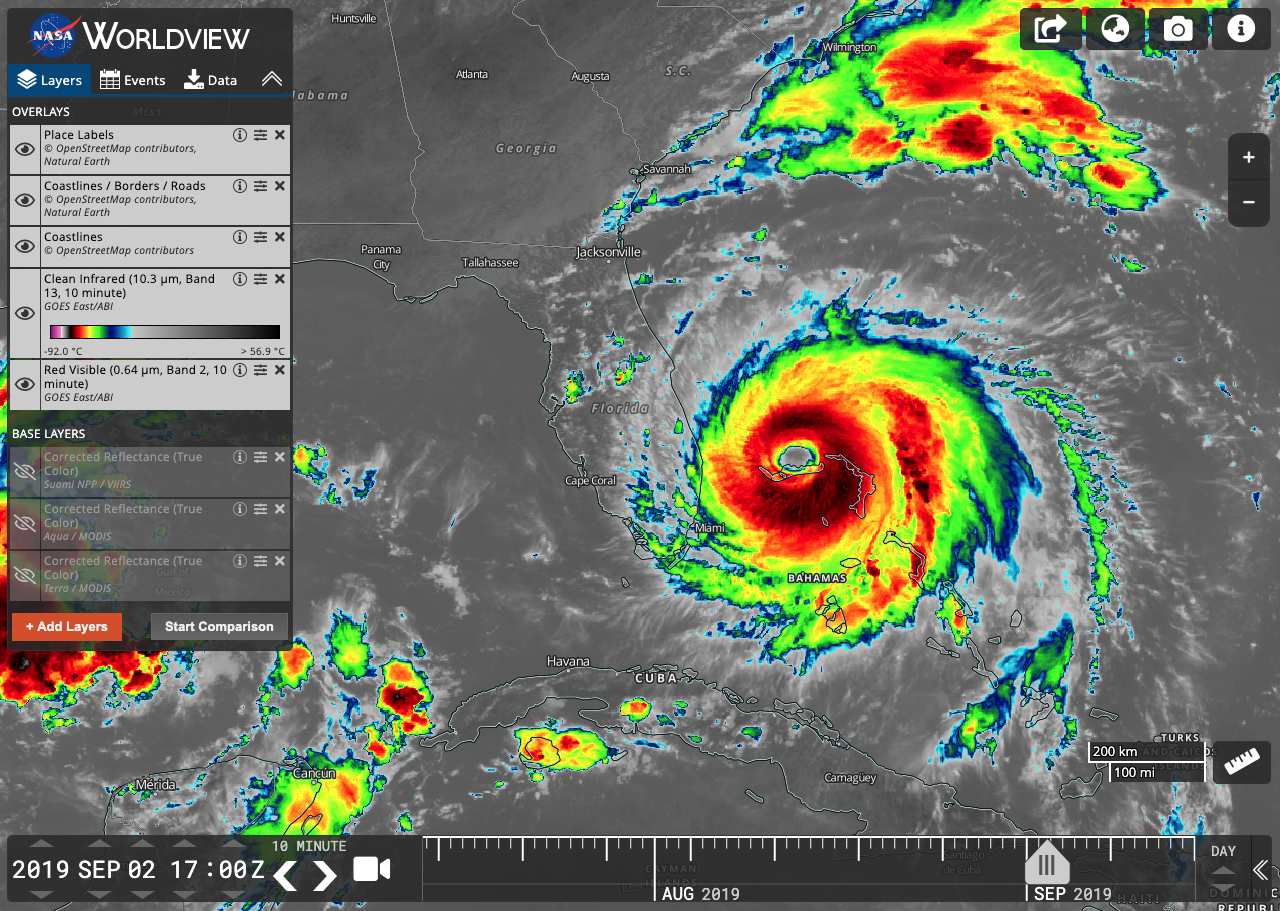
Step 3: View Geostationary Imagery and Step Through Time!
- Enter 2019 SEP 02 17:00 Z in the timeline.
- The GOES-East disk will update to the new date and time and show a greyscale image.
- Zoom into the Bahamas/Florida. Here you can see Hurricane Dorian the day after it made landfall on the Bahamas.
- Add another layer such as "Clean Infrared (10.3 um, Band 13, 10 minute)"
- Click on the forward increment arrow to see the image change at 10 minute increments. The change will be almost imperceptible as the imagery is loading. Click on the back arrow several times to cache the imagery and click on the forward arrow again, you will be able to see the storm's rotation.
TIP: The Red Visible layer is only available during the daytime; the Clean Infrared and Air Mass layers are available all day!
Step 4: Set Up Animation
- To make it even easier to watch the storm's progression, set up an animation!
- Click on the Video Camera icon in the timeline.
- Set the second date and time fields to 2019 SEP 02 21:00 Z; set the first date and time fields to 2019 SEP 02 17:00 Z.
- Click on the "Play" button and watch the storm move!
- Click on the "Create Animated GIF" icon on the right to download an animated GIF of the animation, like below:
Check out our latest Worldview tour story that shows off the geostationary imagery - Hurricane Dorian (September 2019)
Read more about Geostationary imagery on the Earthdata website - Now Available in Worldview: Earth Every 10 Minutes
and MOST IMPORTANTLY, get started with geostationary imagery in Worldview!
As always, if you have any comments or feedback, contact us at support@earthdata.nasa.gov
PS: geostationary imagery isn't just for hurricanes and clouds! Here's an example showing a recent fire in northern California combining red band imagery from GOES-West with fires and thermal anomalies from Suomi NPP / VIIRS over the morning of 2019-10-27:


Worldview's camera tool (upper right) in action

The resulting image after clicking "Download" in the camera tool
Summary: we've swapped out the backend service to Worldview's camera tool; you shouldn't notice a thing unless you're scraping directly from the (undocumented / deprecated) backend service.
If you've used Worldview's camera tool in the upper right corner of the app, you may have noticed that it can open a new window with a URL like this:
That URL requested a custom image with your specified bounding box, layers, file format, output resolution, etc... using the legacy "Image Download" service. With the advent of the new Worldview Snapshots tool and backend, we've consolidated how those custom images are generated. In fact, we've already transitioned the Worldview camera tool to use the Worldview Snapshots backend. So the same request above now looks like this:
As mentioned in the Summary, this shouldn't have an impact on regular Worldview usage. This post is geared toward those who are still directly using the undocumented, and now deprecated, "Image Download" service - we know you're out there! You'll need to transition your current requests by either
- creating an equivalent https://wvs.earthdata.nasa.gov/api/v1/snapshot request (use the Worldview Snapshots app or Worldview's camera tool for examples) or
- crafting a Web Map Service (WMS) request to generate your custom imagery.
We plan to decommission the "Image Download" service in April Summer 2019 which will then return a static image with an error message and pointer to this page.
Please contact us at support@earthdata.nasa.gov if you have any questions or concerns.
First released in 1999, the Open Geospatial Consortium (OGC) Web Map Service (WMS) has been a stalwart of standards used to flexibly serve map-based imagery through an HTTP interface for two decades. While GIBS has long used the newer OGC Web Map Tile Service (WMTS) to rapidly distribute its earth science data visualizations, we've found that there are still a number of use cases which are better served by the WMS interface. These include:
- Geographic Information System (GIS) Client Support - users can configure their GIS client to interact with the WMS interface to facilitate an interactive experience with the GIBS visualizations.
- Custom Image Request - users can interact directly with the WMS interface to request custom images defined by their own bounding box and output dimensions, layer list and order, and output format.
Our new service is available in the "Geographic" (EPSG:4326), Web Mercator (EPSG:3857), Arctic polar stereographic (EPSG:3413), and Antarctic polar stereographic (EPSG:3031) projections. And, of course, it supports time-based access to GIBS' historical archive of visualizations.
Check out our updated API documentation for WMS and GIS documentation to see how you might use the new GIBS WMS!
We've been burning the midnight oil to bring you some new features and lots of new imagery in GIBS and Worldview.
Learn more about what's going on around the world with Worldview's new tour!
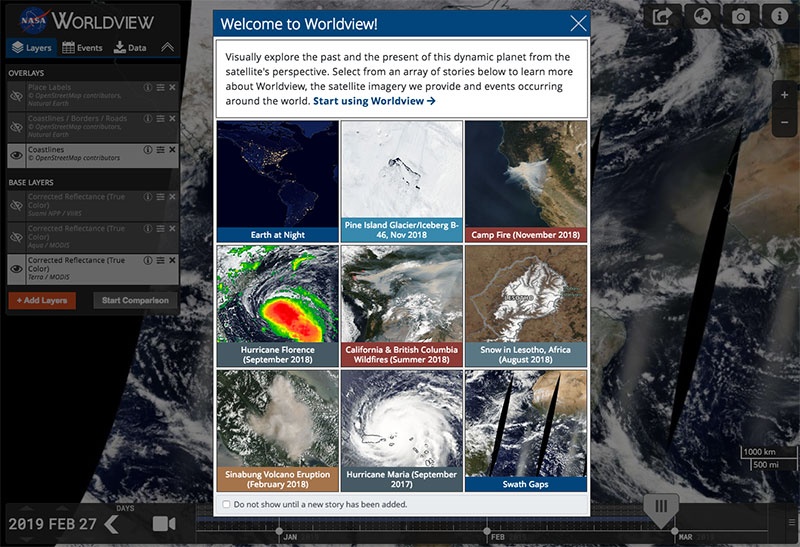
Our latest feature in Worldview is our tour!
This tour is now more story focused, bringing you 9 different stories about events going on around the world, interesting tidbits about the imagery, imagery tutorials and information on how to use Worldview.
We'll update the tour stories regularly to keep it fresh!

Go to Worldview, https://worldview.earthdata.nasa.gov to check it out!
Tip: If you get tired of seeing the tour window every time you open Worldview, check the box "Do not show until a new story has been added".
And all the new imagery...!
We've fallen way behind on letting you know about the new imagery in GIBS and Worldview. We've come to a whopping 800+ imagery layers, adding almost 200 layers since our last imagery related blog post in September 2017, and the number keeps on growing! Go to the following page to see the full list of available imagery products.
Daily and 8-day Imagery Layers
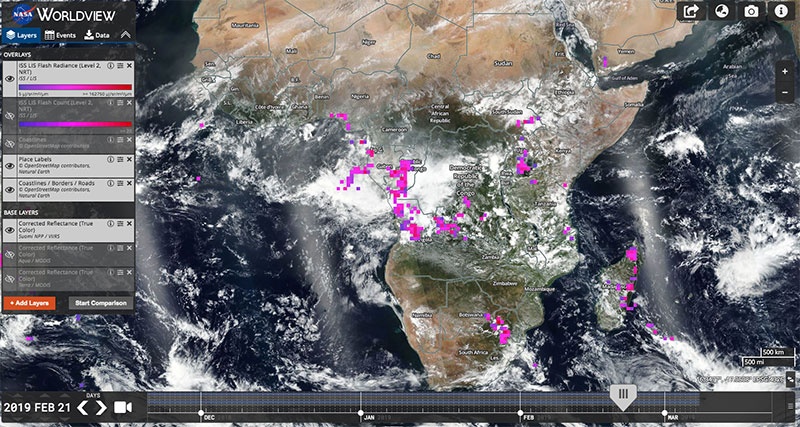
ISS/LIS Lightning Flash Count and Radiance over Africa
Lightning (6 layers): TRMM LIS Flash Radiance (Level 2, Standard); Calibrated Flash Radiance (OTD / Microlab-1); DMSP-F12 OLS Digital Derived Lightning (Level 3, Standard, OLS / DMSP-F12); DMSP-F10 OLS Digital Derived Lightning (Level 3, Standard, OLS / DMSP-F10), ISS/LIS Flash Radiance and Flash Count.
Sulfur Dioxide (4 layers): Sulfur Dioxide: Planetary Boundary layer; Lower Troposphere; Middle Troposphere; Upper Troposphere and Stratosphere.
Atmospheric Infrared Sounder (AIRS) Daily Level 3 imagery (14 layers): Outgoing Longwave Radiation (Day | Night, Daily); Clear Sky Outgoing Longwave Radiation (Day | Night, Daily), Carbon Monoxide (500hPa, Day | Night, Daily); Methane (400hPa, Day | Night, Daily); Surface Air Temperature (Day | Night, Daily); Surface Relative Humidity (Day | Night, Daily); Surface Skin Temperature (Day | Night, Daily)
Soil Moisture (5 layers): GCOM-W1 AMSR2 LPRM Surface Soil Moisture C1-band (Day | Night, Daily); GCOM-W1 AMSR2 LPRM Surface Soil Moisture C1-band (Downscaled, Day | Night, Daily); SMAP/Sentinel-1 Soil Moisture
Sea Surface Currents/Height Anomalies/Temperature (8 layers): Sea Surface Currents (Zonal, OSCAR); Sea Surface Currents (Meridional, OSCAR); Sea Surface Height Anomalies (GDR Cycles, TOPEX/Poseidon, JASON); Sea Surface Height Anomalies (US West Coast, GAFECC, TOPEX/Poseidon, JASON); Sea Surface Currents (Zonal, US West Coast, GAFECC, TOPEX/Poseidon, JASON); Sea Surface Currents (Meridional, US West Coast, GAFECC, TOPEX/Poseidon, JASON); Sea Surface Height Anomalies (Reconstructed, TOPEX/Poseidon, JASON); Sea Surface Temperature (L4, AVHRR-OI)
Sea Ice (2 layers): AMSRU2 Sea Ice Concentration; AMSRU2 Sea Ice Brightness Temperature

OMPS Aerosol Index (PyroCumuloNimbus) over North America during the Summer 2018 wildfire season
Aerosols (5 layers): OMI UV Aerosol Index; OMPS Aerosol Index; OMPS Aerosol Index (PyroCumuloNimbus); SeaWiFS DeepBlue Aerosol Optical Thickness 550nm (Daily); SeaWiFS DeepBlue Aerosol Angstrom Exponent (Daily)
Wind Speed (1 layer): CYGNSS Wind Speed Daily
Advanced Microwave Sounding Unit-A (AMSU-A) imagery (45 layers): Brightness Temperature Channels 1 - 15 from NOAA-15 (3 August 1998 - present), NOAA-16 (27 May 2001 - 3 March 2008) and NOAA-17 (21 July 2002 - 28 October 2003).
Absolute Dynamic Topography (1 layer): Absolute Dynamic Topography (AVISO)
Liquid Water Equivalent Thickness (11 layers): Liquid Water Equivalent Thickness (Mascon, CRI, GRACE Tellus); Liquid Water Equivalent Thickness (Mascon, GRACE Tellus); Liquid Water Equivalent Thickness (Land, GFZ, GRACE Tellus); Liquid Water Equivalent Thickness (Land, JPL, GRACE Tellus); Liquid Water Equivalent Thickness (Land, CSR, GRACE Tellus); Liquid Water Equivalent Thickness (Ocean, GFZ, GRACE Tellus); Liquid Water Equivalent Thickness (Ocean, JPL, GRACE Tellus); Liquid Water Equivalent Thickness (Ocean, CSR, GRACE Tellus); Liquid Water Equivalent Thickness (Ocean, EOF, GFZ, GRACE Tellus); Liquid Water Equivalent Thickness (Ocean, EOF, JPL, GRACE Tellus); Liquid Water Equivalent Thickness (Ocean, EOF, CSR, GRACE Tellus)
Sea Surface Salinity 8-Day (2 layers): Sea Surface Salinity (L3, 8-Day Running Mean, Radiometer); Sea Surface Salinity (L3, CAP, 8-Day Running Mean, Radiometer)
Monthly Imagery Layers
Aerosols (2 layers): SeaWiFS DeepBlue Aerosol Optical Thickness 550nm (Monthly); SeaWiFS DeepBlue Aerosol Angstrom Exponent (Monthly).
Sea Surface Salinity (2 layers): Sea Surface Salinity (L3, Monthly, Radiometer); Sea Surface Salinity (L3, CAP, Monthly, Radiometer,).
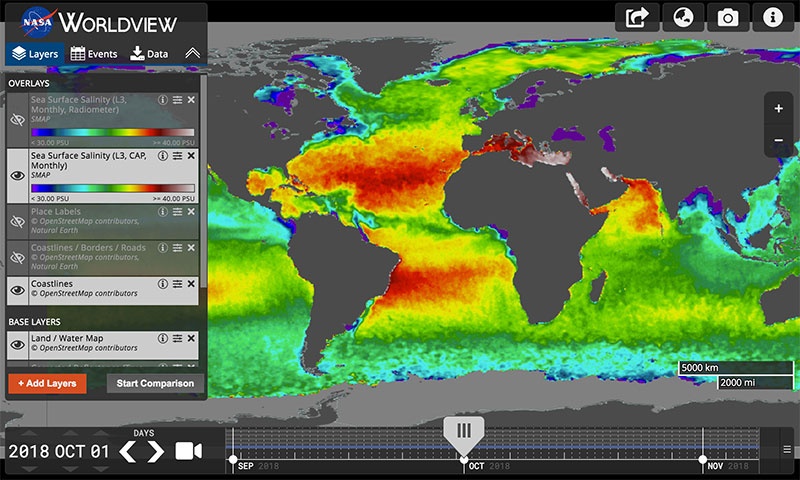
Soil Moisture Active Passive (SMAP) Sea Surface Salinity (L3, CAP, Monthly)
Modern-Era Retrospective analysis for Research and Applications, Version 2 (MERRA-2) imagery (26 layers):
- 2-meter Air Temperature
- Total Precipitation Bias Corrected
- Snowfall
- Soil Water Root Zone
- Evaporation over Land
- SO2 Column Mass Density ENSEMBLE
- Dust Surface Mass Concentration PM2.5
- Dust Surface Mass Concentration
- Total Aerosol Optical Thickness Scattering 550nm
- Total Aerosol Optical Thickness Extinction 550nm
- Total Dust Deposition, Dry+Wet All Bins
- Evaporation from Turbulence
- Surface Albedo
- Carbon Monoxide Emission ENSEMBLE
- ISCCP Cloud Albedo
- Snow Depth Over Glaciated Surface
- Incident Shortwave Over Land
- Open Water Latent Energy Flux
- Total Precipitable Water Vapor
- 2-meter Air Temperature, Assimilated
- Aerosol Optical Depth Analysis
- Surface Wind Speed
- Air Temperature at 250hPa
- Ozone Mixing Ratio at 50hPa
- Relative Humidity After Moist at 700hPa
- Convective Rainwater Source at 700hPa
Composite and Reference Layers
Socioeconomic imagery (47 layers)
- Croplands
- Pastures
- Anthropogenic Biomes
- Drought Hazard: Frequency and Distribution, Mortality Risk, Economic Risk
- Cyclone Hazard: Frequency and Distribution, Mortality Risk, Economic Risk
- Flood Hazard: Frequency and Distribution, Mortality Risk, Economic Risk
- Volcano Hazard: Frequency and Distribution, Mortality Risk, Economic Risk
- Estimated Migration by Decade: 1970-1980, 1980 -1990, 1990-2000
- Population Density: 2000, 2005, 2010, 2015, 2020
- Urban Extent; Human Footprint
- Last of the Wild
- Urban-Rural Extent Below 10m
- Particulate Matter below 2.5 micrometers 2001-2010, 2010-2012
- Mangrove Forest
- Probabilities of Urban Expansion
- Summer Day Maximum Land Surface Temperature
- Summer Night Minimum Land Surface Temperature
- Ground Level Nitrogen Dioxide 3 year running mean 1996-1998, 2010-2012
- Amphibian Richness: All Species, Vulnerable Species, Critically Endangered Species, Endangered Species, All Threats
- Mammal Richness: All Species, Vulnerable Species, Critically Endangered Species, Endangered Species, All Threats
- Human Built-up and Settlement Extent
- Impervious Surface Percentage
Land Cover (1 layer): WELD 5 Year Tree Cover
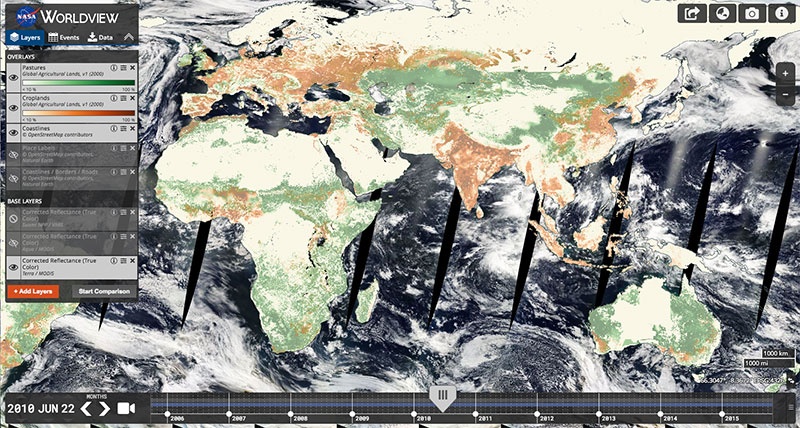
SEDAC Croplands and Pastures layers

WELD 5 year Tree Cover composite over the continental USA
Reference
Orbit Tracks (Ascending | Descending) (18 layers): Sentinel 1A, Sentinel 1B , Sentinel 2A, Sentinel 2B, Sentinel 5P, ICESat-2, MetOP-C, GCOM-C and Landsat 7.
The Global Imagery Browse Services (GIBS) and Worldview Teams have developed a new tool called Worldview Snapshots. Worldview Snapshots is a lightweight tool for creating image snapshots from a selection of popular NASA satellite imagery layers provided through GIBS.

You can preview and download imagery in different band combinations and add overlays on the imagery of active fire/thermal anomalies detections, coastlines, borders and roads. Once you've selected your desired area of interest and parameters - map projection, date, layers, bounding box, and image file options - click on the "Preview" button. Saving the URL in the "Share Image" box in the Preview pane and clicking the checkbox next to either "Always show today" or "Always show yesterday" will ensure that every time you visit that URL you will always get today's image or yesterday's image depending on which option you picked. Click on "Download Image" to get your desired image.

If you're familiar with Rapid Response, you may know that it is being decommissioned and Worldview Snapshots is its replacement. If you like to maintain your Rapid Response Subset bounding boxes, the links on this page will direct you to the same Rapid Response bounding box area in Worldview Snapshots.

Learn more about Worldview Snapshots in this article: Introducing Worldview Snapshots and start using Worldview Snapshots - https://wvs.earthdata.nasa.gov
We’ve been working so hard this past year that we forgot to keep our blog up to date! Never fear, we are here now to bring you up to speed on all of the new and shiny features and layers we provide in Worldview.
The most recent and most exciting update: We’ve added a comparison feature! Compare the same imagery from two different dates, compare different imagery for the same date or whatever combination of the above that you like! The comparison feature provides 3 different tools to investigate the imagery – swipe, opacity, and spy. The comparison feature aids in investigating changes between two time periods or quickly comparing different types of imagery on the same date.
Getting Started with the Comparison Tool
Click on “Start Comparison”
The layer list on the left will now show two tabbed layer lists labeled “A” and “B”. Tab A shows the current day, and tab B shows the previous day. The timeline also has “A” and “B” selectors to show which date you are on.
The map now shows the Swipe mode: A vertical line has appeared on the map with the left side labeled “A” and the right side labeled “B”. Click and hold your mouse on the line and move the line left and right to see the changes from one date to another.
You can also change the Compare Mode to Opacity and Spy. Opacity fades from one day’s image to another; spy positions a circular looking glass on the map showing the B state within the circle.
Click on “Exit Comparison” to get out of Comparison mode. You’ll be left on the last tab you had active - maintaining the layers and the date you were last on.
Some interesting comparisons to start you off:
- Agricultural expansion from 2000 - 2018 in Paraguay: https://go.nasa.gov/2NhTIZk
- Fires in California (Spy) - Same day, different imagery: https://go.nasa.gov/2DJGDbR
- Fires in California (Swipe) - Different days, same imagery: https://go.nasa.gov/2QYGaoy
- Snowfall in Lesotho (Swipe): https://go.nasa.gov/2Nj4GO5
- Changes in the Aral Sea (Opacity): https://go.nasa.gov/2RnnTkU

This animated GIF demonstrates Worldview's Comparison feature, using the Opacity mode. It demonstrates changes in the Aral Sea in Kazakhstan and Uzbekistan, between 31 July 2000 (A) and 24 August 2017 (B).
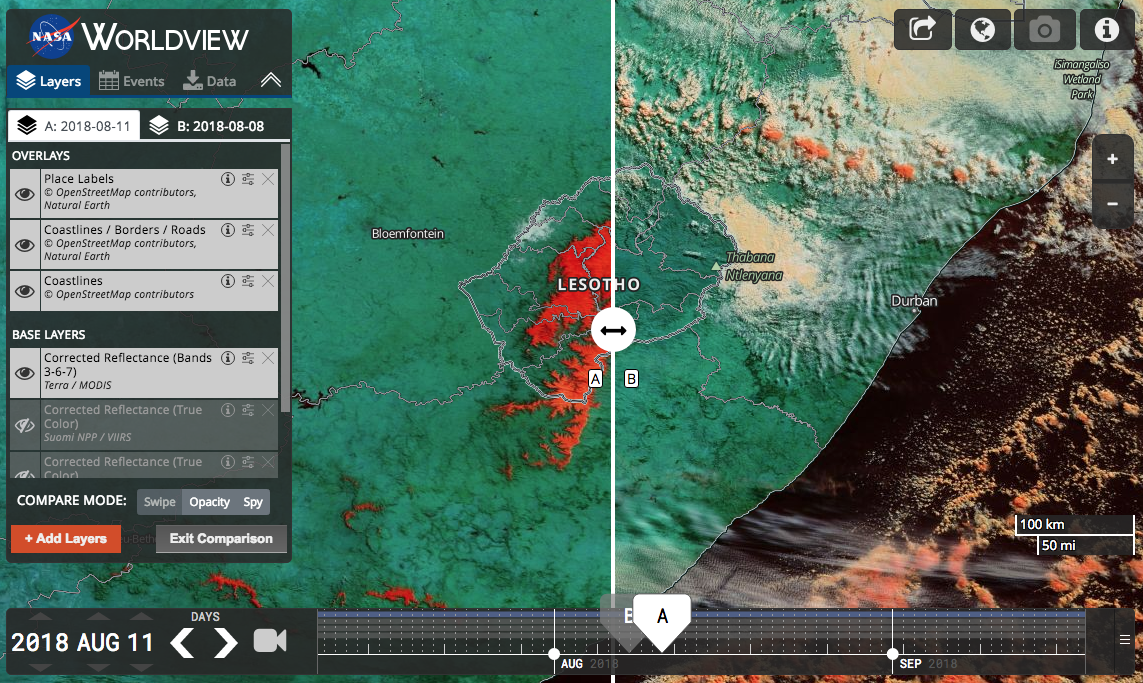
This screenshot demonstrates Worldview's Comparison feature, using the Swipe mode. Snowfall (shown in red using the Corrected Reflectance, Bands 3-6-7 combination) in Lesotho in southern Africa is shown on the left hand side (A) on 11 August 2018, and no snow a few days before on the right hand side (B) on 8 August 2018.
-- Stay tuned for an update on our other new features and abundant new imagery layers!
Worldview and the Global Imagery Browse Services (GIBS) are now offering near real-time true/natural color (RGB) and infrared color (NGB) imagery from the Multi-angle Imaging Spectro-Radiometer (MISR) instrument on the Terra satellite. The imagery are available for the nadir, four fore and four aft views provided by MISR's nine cameras.
That's looking at the earth from 9 different angles in two different band combinations - a total of 18 imagery products!
- An (A Nadir) Natural Color (RGB) | Infrared Color (NGB)
- Af (A Forward) Natural Color (RGB) | Infrared Color (NGB)
- Bf (B Forward) Natural Color (RGB) | Infrared Color (NGB)
- Cf (C Forward) Natural Color (RGB) | Infrared Color (NGB)
- Df (D Forward) Natural Color (RGB) | Infrared Color (NGB)
- Aa (A Aft) Natural Color (RGB) | Infrared Color (NGB)
- Ba (B Aft) Natural Color (RGB) | Infrared Color (NGB)
- Ca (C Aft) Natural Color (RGB) | Infrared Color (NGB)
- Da (D Aft) Natural Color (RGB) | Infrared Color (NGB)
The true/natural color imagery use the Red-Green-Blue (RGB) band wavelength combination to produce images that is similar to what the human eye would see, providing natural-looking images of land surface, oceanic and atmospheric features. The infrared color imagery uses the Near Infrared-Green-Blue (NGB) band wavelength combination to produce images that make it easier to differentiate between types of vegetation and shows vegetation in red, it's also good for identifying surface water.
The spatial resolution of the natural color imagery is 250m. Imagery for the infrared color radiance is at 1 km for the eight off-nadir views and 250m for the nadir view.
The imagery is produced from the MISR Level 1 ellipsoid-projected radiance data products by NASA’s Land, Atmosphere Near real-time Capability for EOS (LANCE) MISR Element at NASA’s Atmospheric Science Data Center (ASDC). These products are generally accessible within two to three hours of a satellite overpass, and are available for viewing through NASA’s Worldview or similar GIBS client systems. Imagery for these products is available from 1 September 2017 to present.
While LANCE near real-time products are not intended to take the place of data products generated by the detailed processing necessary for scientific research, they are an invaluable resource for users needing rapid, continually updated views of ongoing Earth processes.
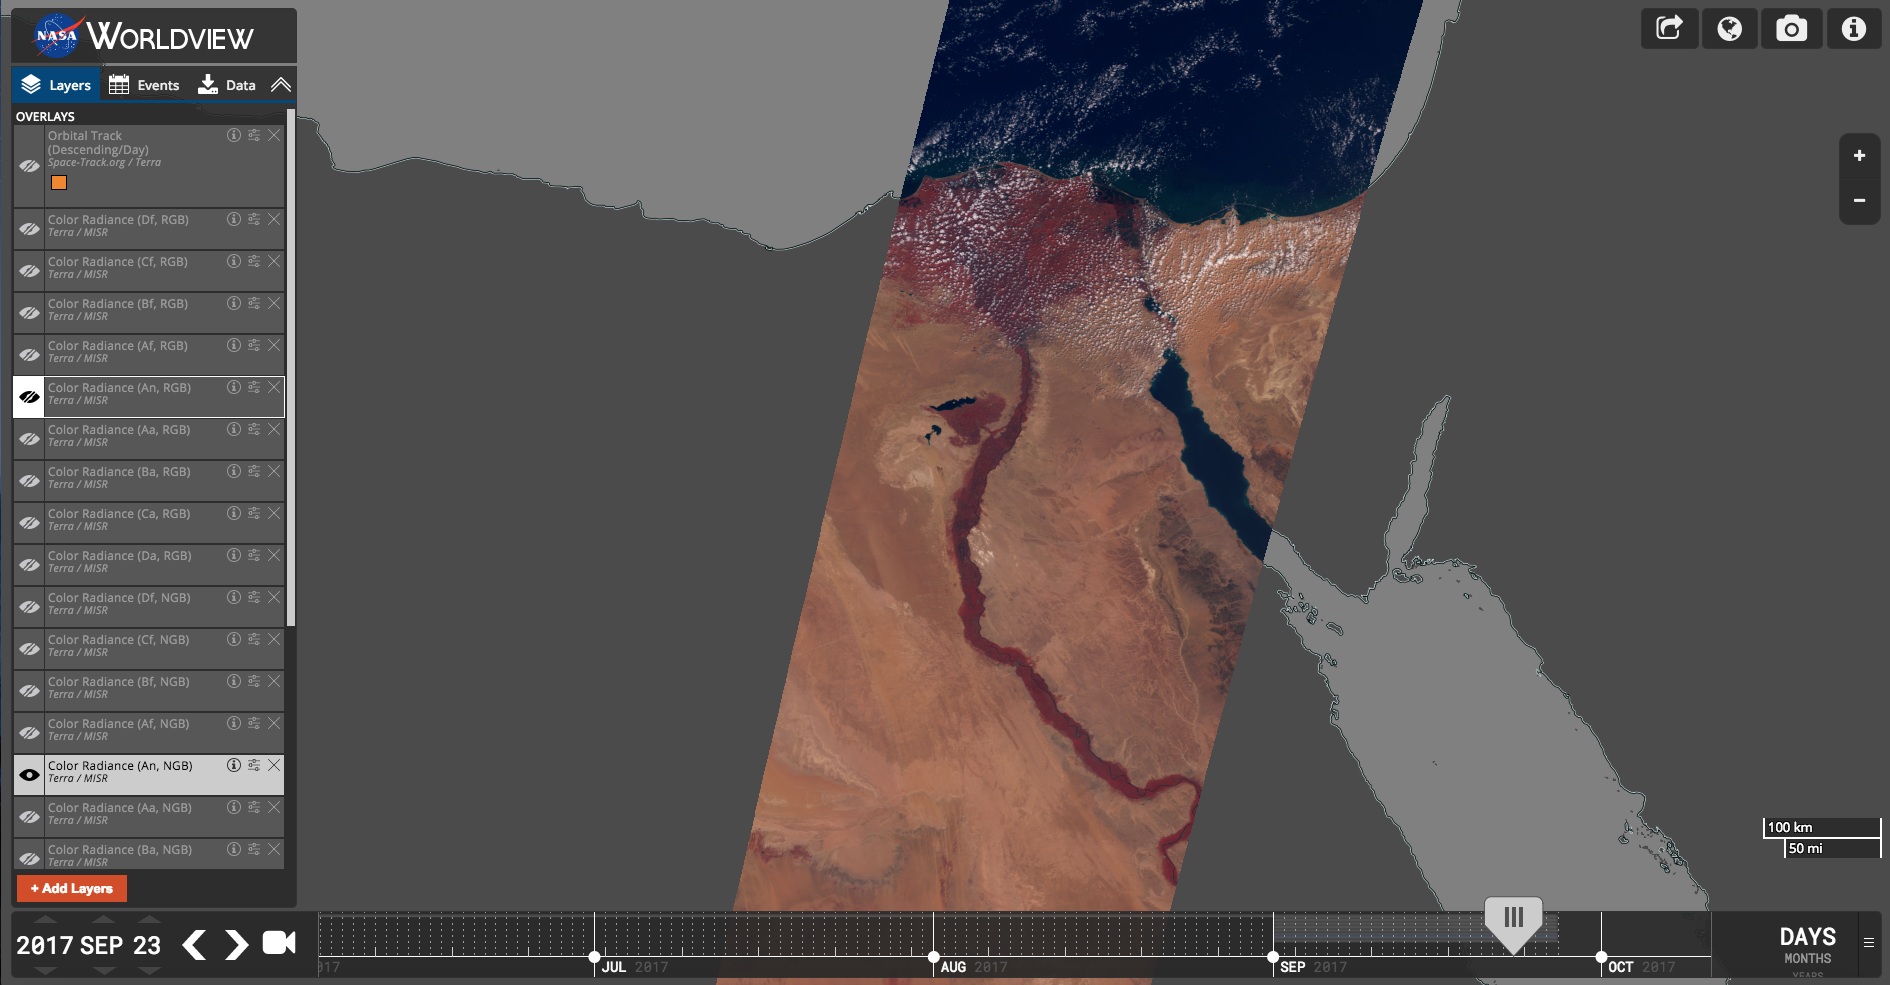
MISR A Nadir, Infrared color (Color Radiance (An, NGB)) image of the Nile River Delta on the 23rd September 2017.

Download the corresponding data in Worldview!

Hurricane Irma on the 7th of September 2017. This animation shows the storm from different angles as imaged by MISR's 9 cameras, in the following order: Df, Cf, Bf, Af, An, Aa, Ba, Ca, Da - viewing forward, downward, and backward along the Terra satellite flight path (overlaid on MODIS/Terra imagery).
GIBS and Worldview are constantly adding new imagery! Here is a list of our most recent additions:
- MODIS Land imagery now goes back to 2009 (Previously MODIS Land imagery was only available from May 2012 onward)
- Daily Mean Lightning Flash Rate (TRMM/LIS): 4 May 1995 - 31 December 2013 (Daily)
- Climatology Mean Lightning Flash Rate (TRMM/LIS): 4 May 1995 - 31 December 2013 composite
- Monthly Mean Lightning Flash Rate (TRMM/LIS): 4 May 1995 - 31 December 2013 (Monthly)
- Seasonal Mean Lightning Flash Rate (TRMM/LIS): 4 May 1995 - 31 December 2013 (Seasonal/3 Month)
The following layers have now been forward processed to the present day/end of most recent month (and will continue to be forward processed):
- MERRA-2 Monthly Surface Skin Temperature and Surface Pressure: January 1980 - present
- NLDAS Monthly: 1 January 1979 - present (Monthly)
- Soil Moisture (Monthly, 0 - 100 cm, VIC LSM)
- Soil Moisture (Monthly, 0 - 100 cm, Noah LSM)
- Soil Moisture (Monthly, 0 - 10 cm, Mosaic LSM)
- Precipitation Total (Monthly, Surface, Primary Forcing Data)
- Air Temperature (Monthly, Near Surface, Primary Forcing Data)
- Precipitation Total (Monthly, Surface, Secondary Forcing Data)
- OMI Aerosol Optical Depth, Ozone and Nitrogen Dioxide Daily: 1 October 2004 - Present
The following layers have been forward processed to May 2017 (and will continue to be forward processed):
- MISR Monthly: March 2000 - May 2017
- Land NDVI Average (Monthly)
- TOA Albedo Average (Red, Monthly)
- Cloud Stereo Height (No Wind Correction, <0.5 km, Monthly)
- Cloud Stereo Height (No Wind Correction, < 1.5 - 2.0 km, Monthly)
- Radiance Average (Monthly, Natural Color)
- Radiance Average (Monthly, Infrared Color)
- Aerosol Optical Depth Average (Green, Monthly)
- Directional Hemispherical Reflectance (DHR) Average (Monthly, Natural Color)
- MOPITT Daily Carbon Monoxide Total Column and Surface Mixing Ratio, Day and Night: March 2000 - May 2017
The following layers have been forward processed to April 2017 (and will continue to be forward processed):
- MOPITT Monthly Carbon Monoxide Total Column and Surface Mixing Ratio, Day and Night: March 2000 - April 2017

Land Surface Reflectance, 28 August 2009 (MODIS/Terra)

Daily Mean Lightning Flash Rate, 23 August 2013 (TRMM/LIS)
Learn more about the imagery
We've made some improvements and now you can find the layer descriptions anytime you bring up a layer. In the past, the descriptions were fairly difficult to find.
Whether you're scrolling through the categories, doing a search in the Layer Picker or even once you've loaded the layer into the Layer List, the descriptions are there!


Share with your friends
When you've found an awesome image in Worldview, you can now share the URL with your friends in Facebook, Twitter (#NASAWorldview), Reddit and via email. Just click on the share icon in the top right corner of Worldview.

Find out when something's gone awry (or when something awesome has been added to Worldview!)
Worldview's incorporated a notification system so that you will be notified within Worldview if imagery delivery has been delayed or system maintenance is in progress. You might even find out if a new and exciting feature has been added to Worldview!

Coming soon...
We're always working on improving Worldview and cooking up the next new feature(s)! Currently, were working on improving our search function and improving the browse and interaction with the Events feed. Check out our new Roadmap to see what our near-, mid- and long-term goals are and what we're prioritizing to work on next!
New Imagery in GIBS and Worldview
GIBS and Worldview continues to expand their offerings of imagery - we have incorporated a whole bunch of new imagery for you to use and interact with!
Worldview 1.4.0 release - New features galore!
Worldview has incorporated some exciting new features to help you explore the planet! In addition to the features mentioned below, we have also included an auto-disable function which prevents a layer from being turned on if there is no imagery available for that date.
Continuous view of the Pacific Ocean
Imagery layers like the MODIS or VIIRS Corrected Reflectance and some other daytime layers can now be viewed over the dateline/antimeridian for the day prior to and after the current date displayed. This allows for an unbroken view of the Pacific Ocean as observed by the satellites.
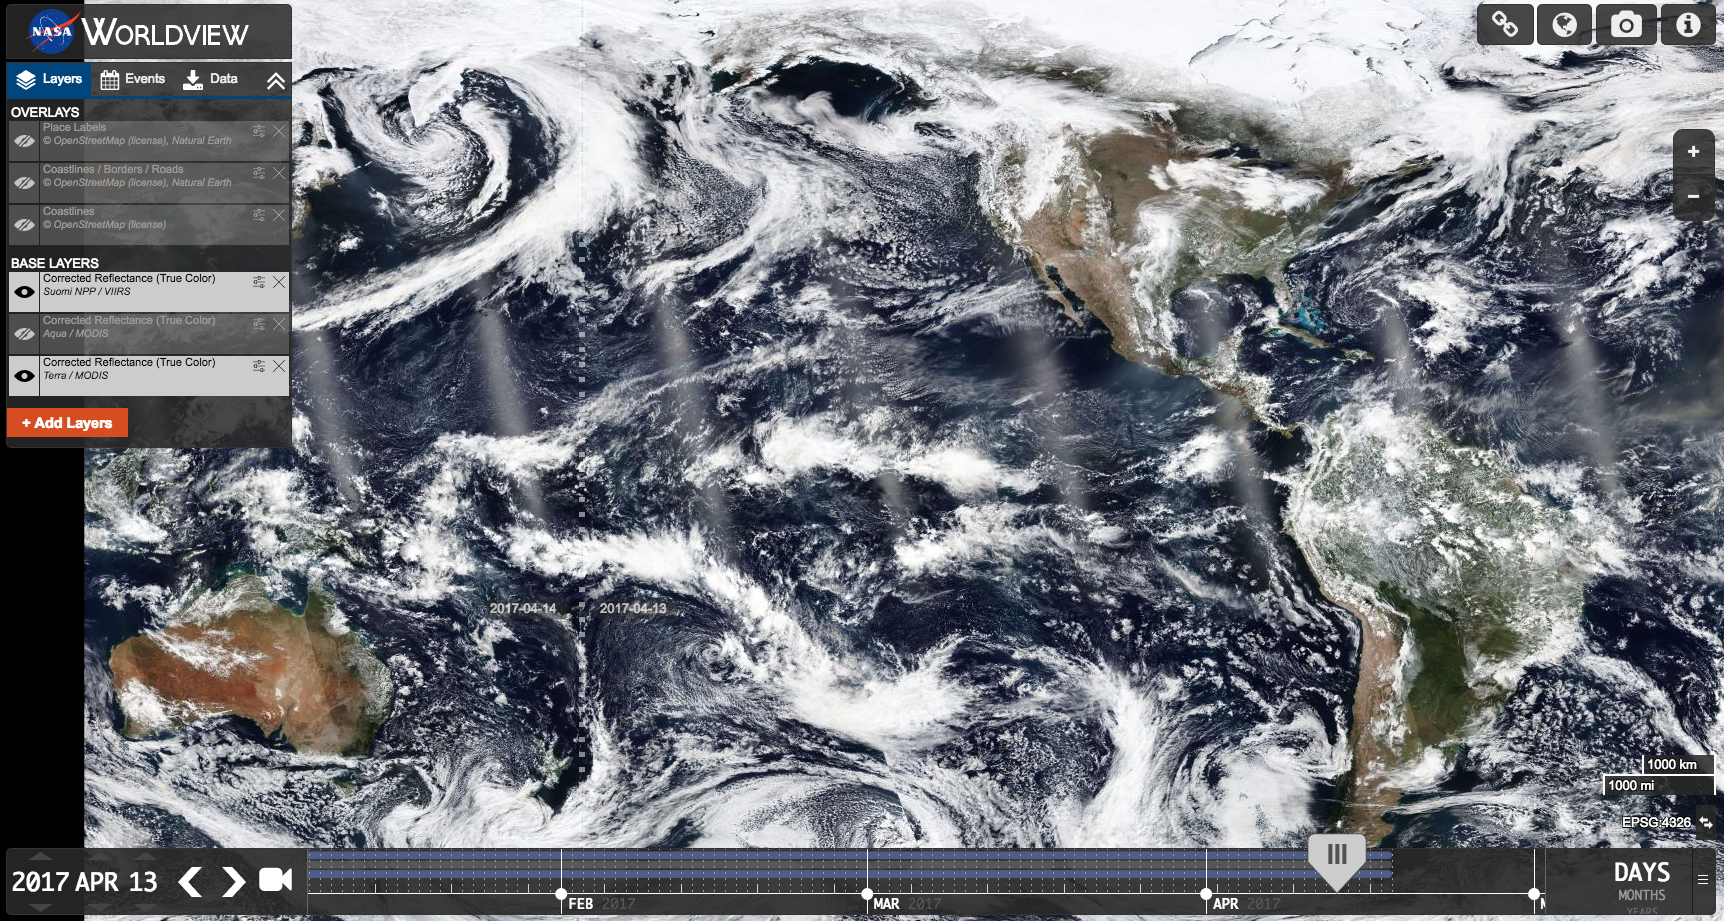
It is now possible to view the Pacific Ocean in a continuous, unbroken view in Worldview. Imagery to the left of the dateline/antimeridian displays April 14 while the imagery to the right of the dateline/antimeridian is April 13.
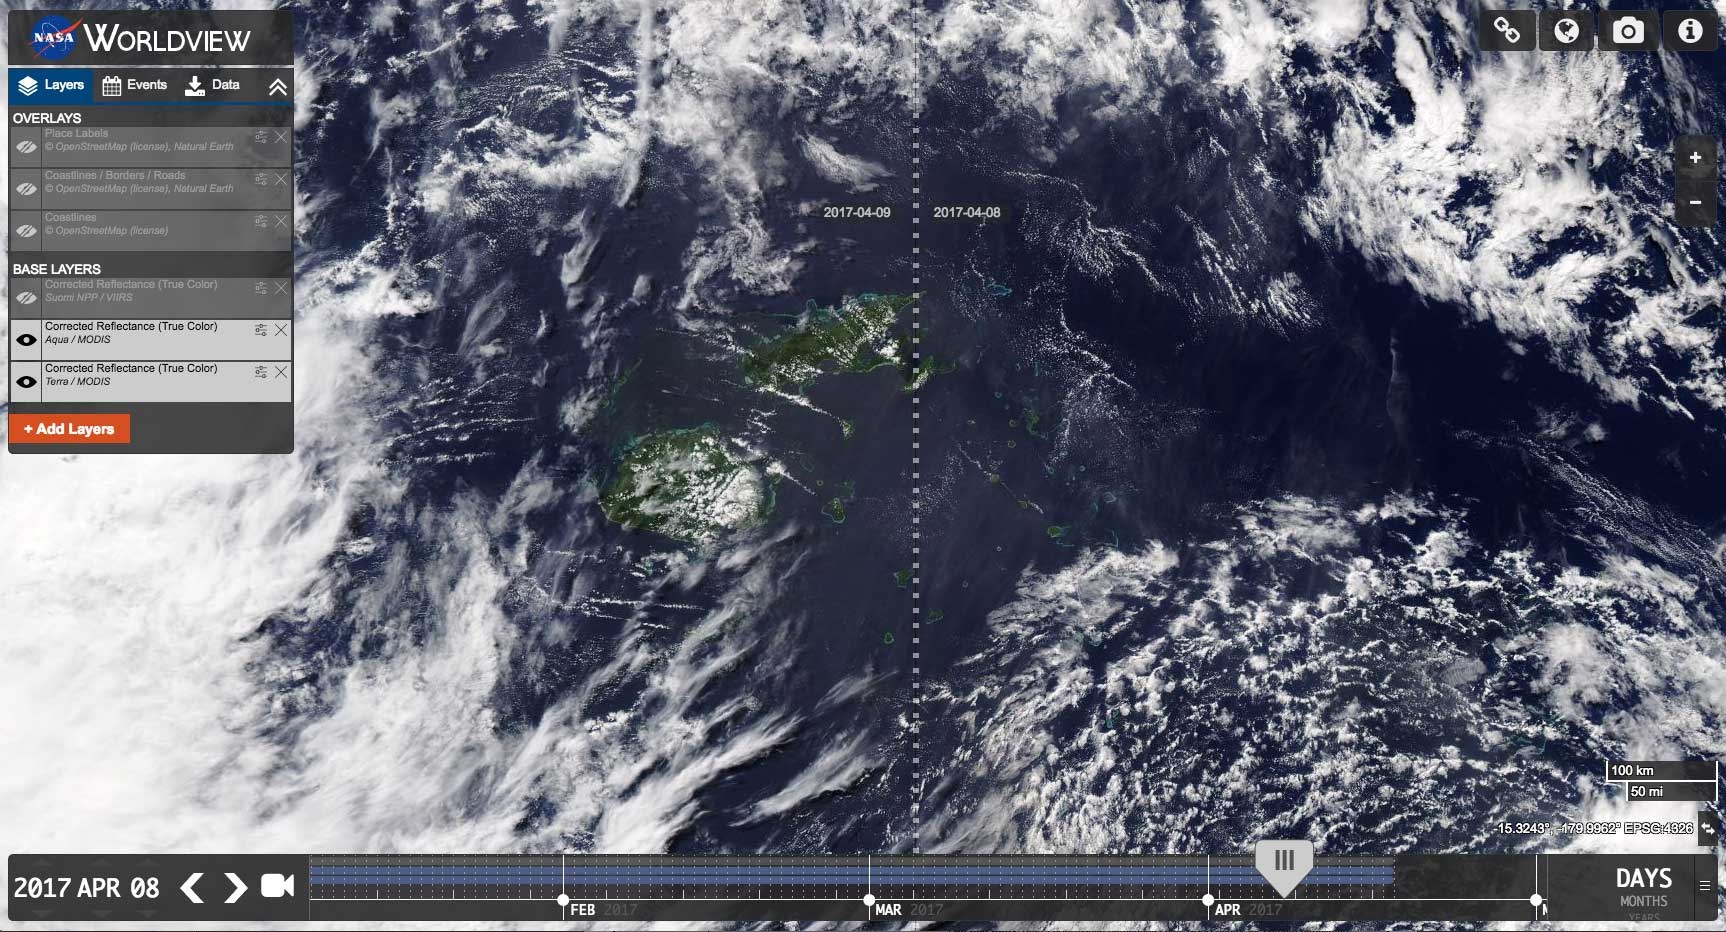
Fiji is an archipelagic country comprised of 300+ islands. Worldview’s new feature allows you to view the entire country since imagery is now displayed across the dateline/antimeridian. Imagery on the left is for April 9 and imagery on the right is for April 8.
Find the information that you’re interested in
Users can now view the data value under the cursor in the respective layer's legend/color bar for relevant discrete/continuous data visualization layers.
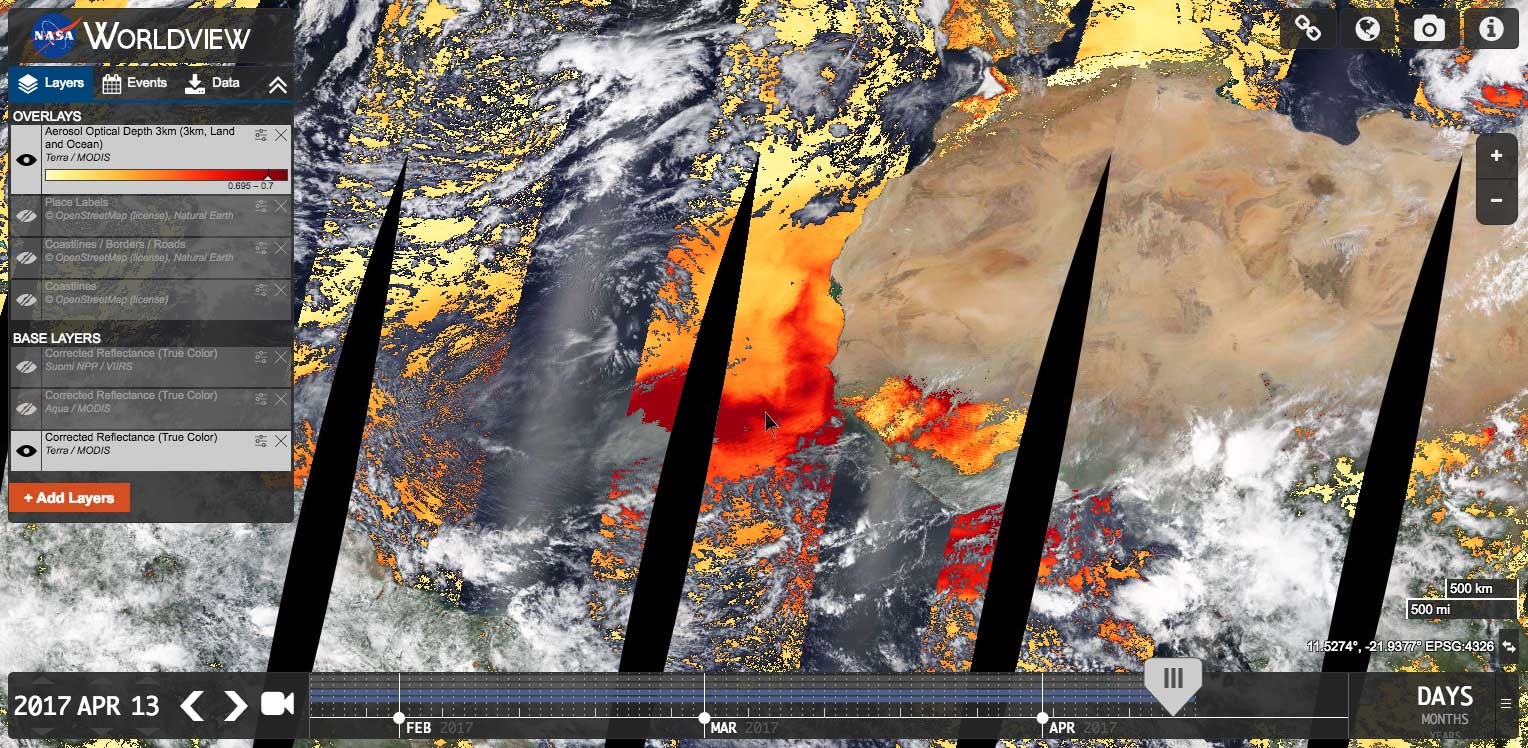
Hover over any location on a layer with a legend/color bar. You will be able to see the corresponding value to that color in the legend. Hovering over the location off the coast of West Africa, where a dust storm is occurring shows an Aerosol Optical Depth of 0.695 – 0.7.
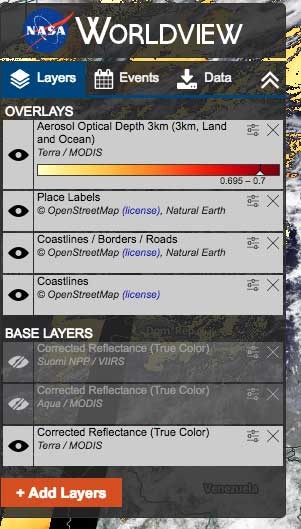
Close up of the legend showing the corresponding image data value.
Updates to the Natural Events Feed – Easier to find events and distinguish between events
A marker or bounding box has been added to illustrate an event’s location shown in the Events feed.
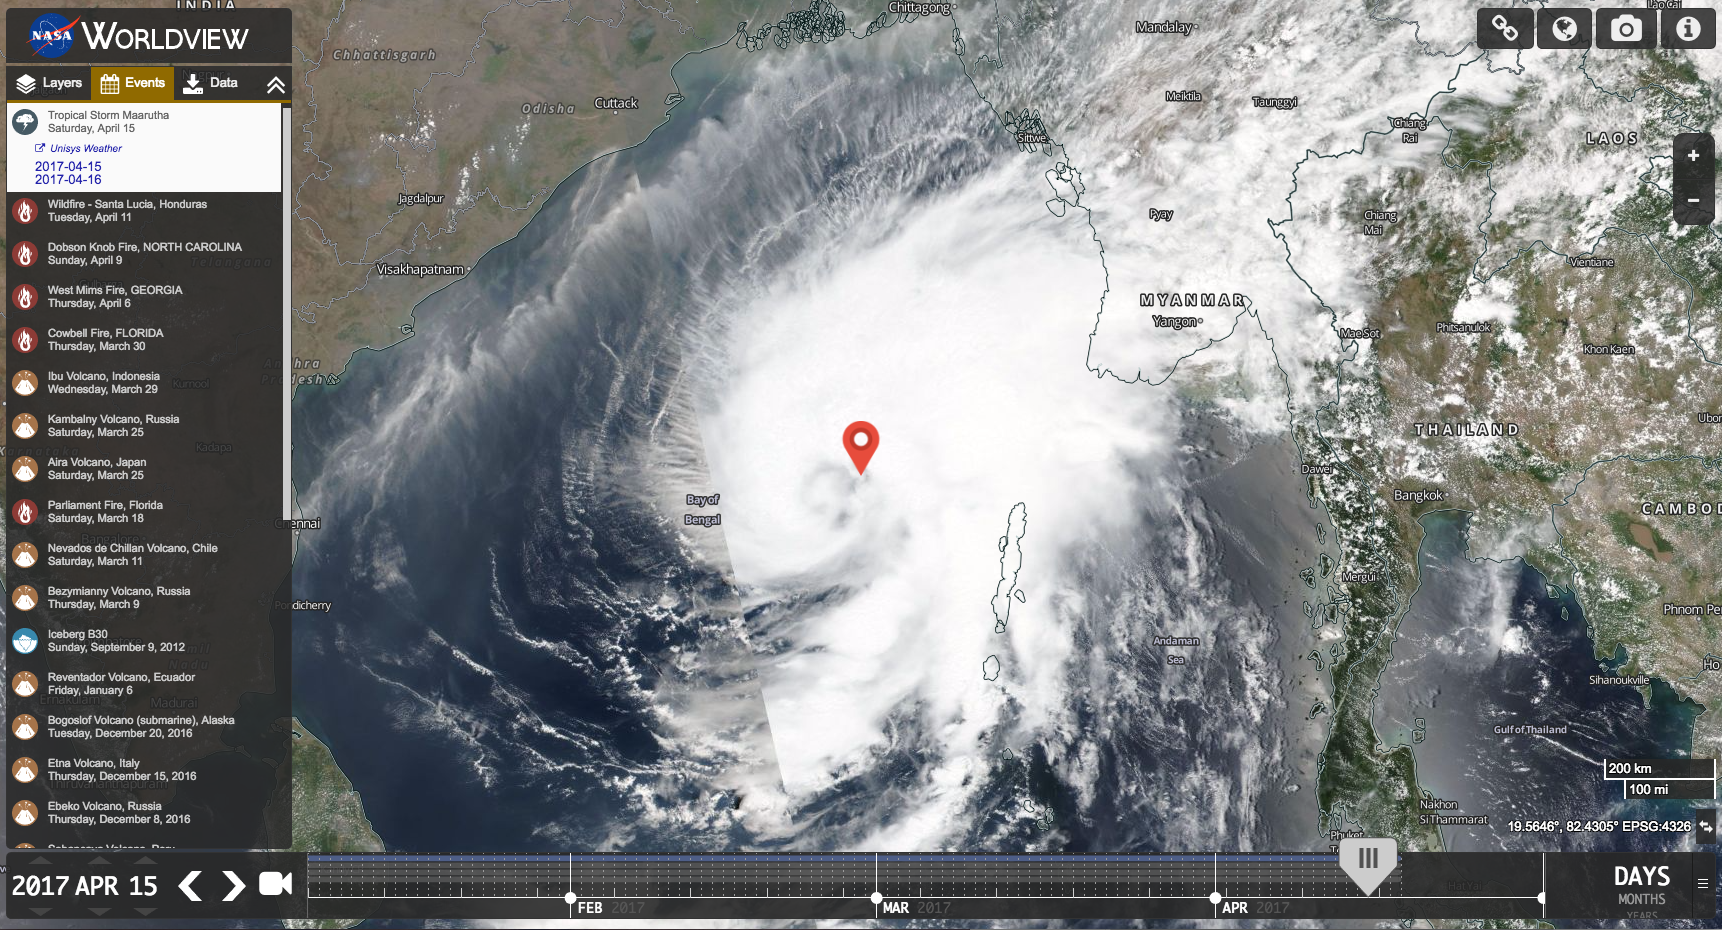
Marker showing the location of Tropical Storm Maarutha on April 15, 2017
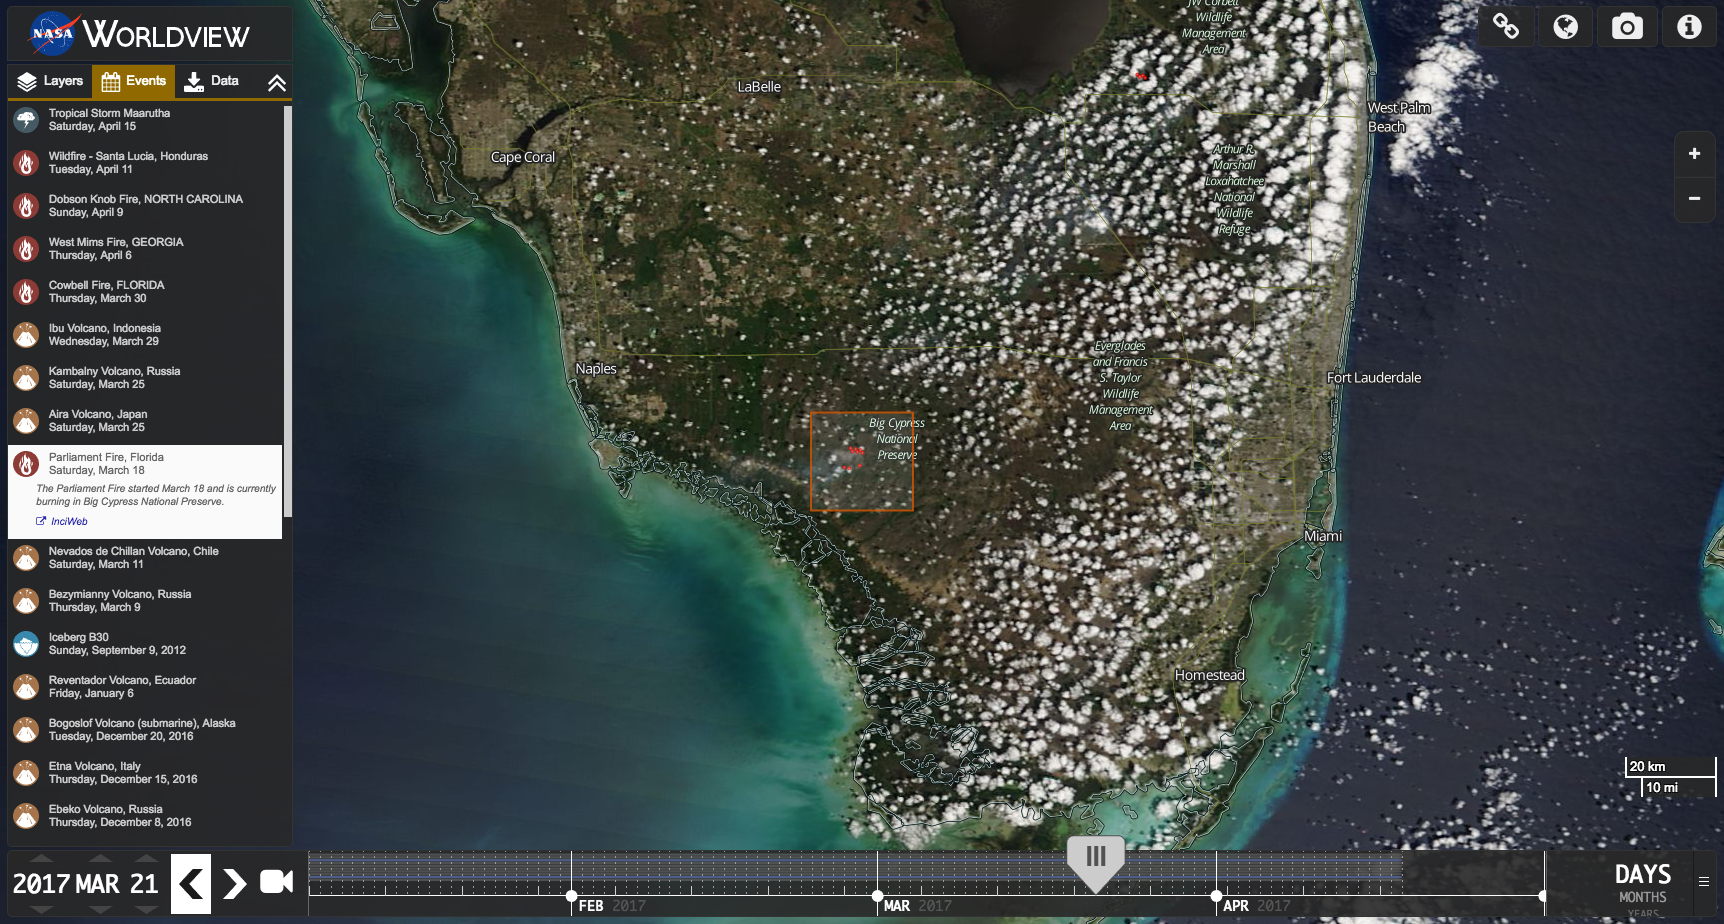
Bounding box showing the location of the Parliament Fire in Florida on March 21, 2017
Icons have been added to differentiate between natural event categories in the Events feed.
![]()
Natural events icons – Many thanks to our newest contributor, CodeMacabre, for developing these beautiful icons!
Update 2017/03/23 20:10 UTC: this issue has been resolved between GIBS and the data provider, VIIRS imagery should now be up to date and being processed. Please report any problems to support@earthdata.nasa.gov and thanks for your patience!
VIIRS near real-time products and some MODIS near real-time atmosphere products have been unavailable in GIBS since March 20, 2017 due to operating system upgrades on the imagery provider's web site.
We are working with the provider to resolve the issues. Sorry for the inconvenience.
Based on directives from the US Department of Homeland Security, we are required to transition our public-facing web services to use the HTTPS protocol and deprecate support for HTTP.
All of our production web services currently support both HTTP and HTTPS, though beginning on March 13, 2017, any HTTP requests will return a “301 Moved Permanently” response code which most browsers will automatically redirect to use HTTPS. Hopefully this transition will be seamless to most of you - please see here if any action is needed on your part:
| Tool / Library | Impact |
|---|---|
| Worldview users | Unaffected as it already uses HTTPS to retrieve GIBS imagery |
| OpenLayers / Leaflet / Cesium mapping libraries | Will automatically redirect GIBS requests to HTTPS although this may incur extra network traffic during initial HTTP exchanges |
| Script-based access using GDAL | Will automatically redirect GIBS requests to HTTPS although this may incur extra network traffic during initial HTTP exchanges |
| Your custom mapping app | Unknown! Please see below for ways to test and upgrade |
For most developers, this update should involve simply changing the GIBS service endpoint from http to https. Here is a sample of previous endpoints for HTTP-based “geographic” tile requests:
http://map1.vis.earthdata.nasa.gov/wmts-geo/ (circa 2011-2016)
http://gibs.earthdata.nasa.gov/wmts/epsg4326/best/ (2016+)
These URLs should now be replaced by their HTTPS equivalent, e.g:
https://gibs.earthdata.nasa.gov/wmts/epsg4326/best/ (2016+)
See here for our full API documentation:
https://wiki.earthdata.nasa.gov/display/GIBS/GIBS+API+for+Developers
If you would like to test how your HTTP-based application will respond to the HTTP 301 redirect before the transition on March 13, 2017, you can use our User Acceptance Testing (UAT) environment which already has the redirect in place:
http://uat.gibs.earthdata.nasa.gov/wmts/epsg4326/best/
Please contact us at support@earthdata.nasa.gov if you have any questions or concerns.