Blog from March, 2019
search
attachments
weblink
advanced
Overview
Content Tools

Worldview's camera tool (upper right) in action

The resulting image after clicking "Download" in the camera tool
Summary: we've swapped out the backend service to Worldview's camera tool; you shouldn't notice a thing unless you're scraping directly from the (undocumented / deprecated) backend service.
If you've used Worldview's camera tool in the upper right corner of the app, you may have noticed that it can open a new window with a URL like this:
That URL requested a custom image with your specified bounding box, layers, file format, output resolution, etc... using the legacy "Image Download" service. With the advent of the new Worldview Snapshots tool and backend, we've consolidated how those custom images are generated. In fact, we've already transitioned the Worldview camera tool to use the Worldview Snapshots backend. So the same request above now looks like this:
As mentioned in the Summary, this shouldn't have an impact on regular Worldview usage. This post is geared toward those who are still directly using the undocumented, and now deprecated, "Image Download" service - we know you're out there! You'll need to transition your current requests by either
- creating an equivalent https://wvs.earthdata.nasa.gov/api/v1/snapshot request (use the Worldview Snapshots app or Worldview's camera tool for examples) or
- crafting a Web Map Service (WMS) request to generate your custom imagery.
We plan to decommission the "Image Download" service in April Summer 2019 which will then return a static image with an error message and pointer to this page.
Please contact us at support@earthdata.nasa.gov if you have any questions or concerns.
First released in 1999, the Open Geospatial Consortium (OGC) Web Map Service (WMS) has been a stalwart of standards used to flexibly serve map-based imagery through an HTTP interface for two decades. While GIBS has long used the newer OGC Web Map Tile Service (WMTS) to rapidly distribute its earth science data visualizations, we've found that there are still a number of use cases which are better served by the WMS interface. These include:
- Geographic Information System (GIS) Client Support - users can configure their GIS client to interact with the WMS interface to facilitate an interactive experience with the GIBS visualizations.
- Custom Image Request - users can interact directly with the WMS interface to request custom images defined by their own bounding box and output dimensions, layer list and order, and output format.
Our new service is available in the "Geographic" (EPSG:4326), Web Mercator (EPSG:3857), Arctic polar stereographic (EPSG:3413), and Antarctic polar stereographic (EPSG:3031) projections. And, of course, it supports time-based access to GIBS' historical archive of visualizations.
Check out our updated API documentation for WMS and GIS documentation to see how you might use the new GIBS WMS!
We've been burning the midnight oil to bring you some new features and lots of new imagery in GIBS and Worldview.
Learn more about what's going on around the world with Worldview's new tour!
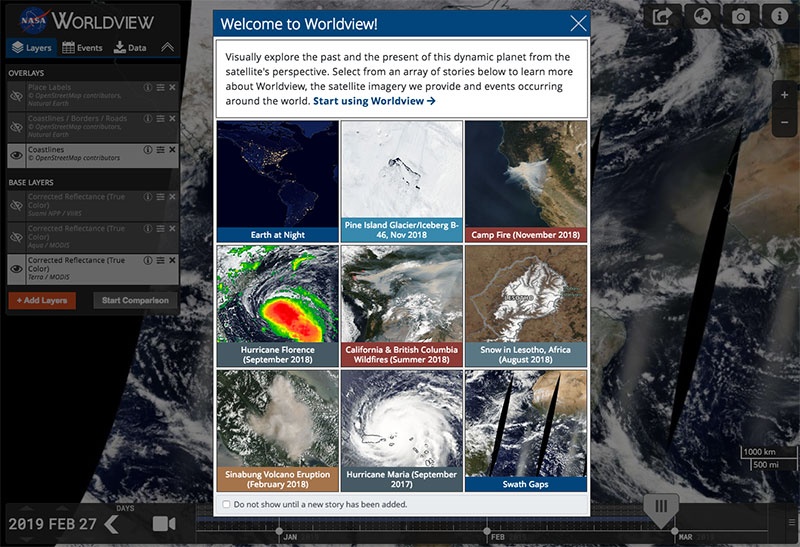
Our latest feature in Worldview is our tour!
This tour is now more story focused, bringing you 9 different stories about events going on around the world, interesting tidbits about the imagery, imagery tutorials and information on how to use Worldview.
We'll update the tour stories regularly to keep it fresh!

Go to Worldview, https://worldview.earthdata.nasa.gov to check it out!
Tip: If you get tired of seeing the tour window every time you open Worldview, check the box "Do not show until a new story has been added".
And all the new imagery...!
We've fallen way behind on letting you know about the new imagery in GIBS and Worldview. We've come to a whopping 800+ imagery layers, adding almost 200 layers since our last imagery related blog post in September 2017, and the number keeps on growing! Go to the following page to see the full list of available imagery products.
Daily and 8-day Imagery Layers
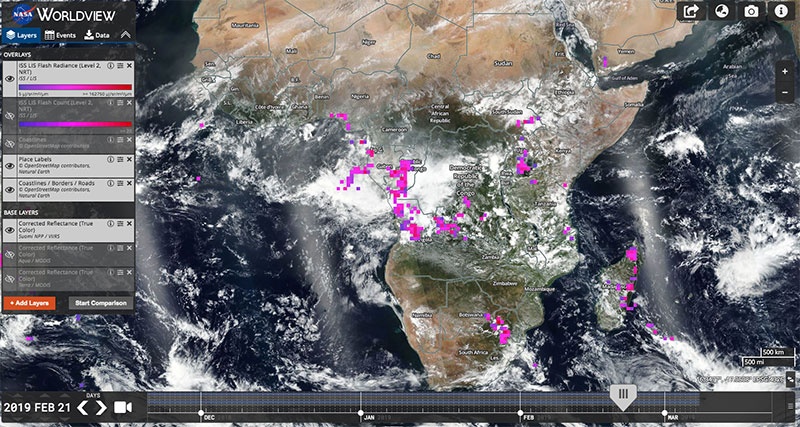
ISS/LIS Lightning Flash Count and Radiance over Africa
Lightning (6 layers): TRMM LIS Flash Radiance (Level 2, Standard); Calibrated Flash Radiance (OTD / Microlab-1); DMSP-F12 OLS Digital Derived Lightning (Level 3, Standard, OLS / DMSP-F12); DMSP-F10 OLS Digital Derived Lightning (Level 3, Standard, OLS / DMSP-F10), ISS/LIS Flash Radiance and Flash Count.
Sulfur Dioxide (4 layers): Sulfur Dioxide: Planetary Boundary layer; Lower Troposphere; Middle Troposphere; Upper Troposphere and Stratosphere.
Atmospheric Infrared Sounder (AIRS) Daily Level 3 imagery (14 layers): Outgoing Longwave Radiation (Day | Night, Daily); Clear Sky Outgoing Longwave Radiation (Day | Night, Daily), Carbon Monoxide (500hPa, Day | Night, Daily); Methane (400hPa, Day | Night, Daily); Surface Air Temperature (Day | Night, Daily); Surface Relative Humidity (Day | Night, Daily); Surface Skin Temperature (Day | Night, Daily)
Soil Moisture (5 layers): GCOM-W1 AMSR2 LPRM Surface Soil Moisture C1-band (Day | Night, Daily); GCOM-W1 AMSR2 LPRM Surface Soil Moisture C1-band (Downscaled, Day | Night, Daily); SMAP/Sentinel-1 Soil Moisture
Sea Surface Currents/Height Anomalies/Temperature (8 layers): Sea Surface Currents (Zonal, OSCAR); Sea Surface Currents (Meridional, OSCAR); Sea Surface Height Anomalies (GDR Cycles, TOPEX/Poseidon, JASON); Sea Surface Height Anomalies (US West Coast, GAFECC, TOPEX/Poseidon, JASON); Sea Surface Currents (Zonal, US West Coast, GAFECC, TOPEX/Poseidon, JASON); Sea Surface Currents (Meridional, US West Coast, GAFECC, TOPEX/Poseidon, JASON); Sea Surface Height Anomalies (Reconstructed, TOPEX/Poseidon, JASON); Sea Surface Temperature (L4, AVHRR-OI)
Sea Ice (2 layers): AMSRU2 Sea Ice Concentration; AMSRU2 Sea Ice Brightness Temperature

OMPS Aerosol Index (PyroCumuloNimbus) over North America during the Summer 2018 wildfire season
Aerosols (5 layers): OMI UV Aerosol Index; OMPS Aerosol Index; OMPS Aerosol Index (PyroCumuloNimbus); SeaWiFS DeepBlue Aerosol Optical Thickness 550nm (Daily); SeaWiFS DeepBlue Aerosol Angstrom Exponent (Daily)
Wind Speed (1 layer): CYGNSS Wind Speed Daily
Advanced Microwave Sounding Unit-A (AMSU-A) imagery (45 layers): Brightness Temperature Channels 1 - 15 from NOAA-15 (3 August 1998 - present), NOAA-16 (27 May 2001 - 3 March 2008) and NOAA-17 (21 July 2002 - 28 October 2003).
Absolute Dynamic Topography (1 layer): Absolute Dynamic Topography (AVISO)
Liquid Water Equivalent Thickness (11 layers): Liquid Water Equivalent Thickness (Mascon, CRI, GRACE Tellus); Liquid Water Equivalent Thickness (Mascon, GRACE Tellus); Liquid Water Equivalent Thickness (Land, GFZ, GRACE Tellus); Liquid Water Equivalent Thickness (Land, JPL, GRACE Tellus); Liquid Water Equivalent Thickness (Land, CSR, GRACE Tellus); Liquid Water Equivalent Thickness (Ocean, GFZ, GRACE Tellus); Liquid Water Equivalent Thickness (Ocean, JPL, GRACE Tellus); Liquid Water Equivalent Thickness (Ocean, CSR, GRACE Tellus); Liquid Water Equivalent Thickness (Ocean, EOF, GFZ, GRACE Tellus); Liquid Water Equivalent Thickness (Ocean, EOF, JPL, GRACE Tellus); Liquid Water Equivalent Thickness (Ocean, EOF, CSR, GRACE Tellus)
Sea Surface Salinity 8-Day (2 layers): Sea Surface Salinity (L3, 8-Day Running Mean, Radiometer); Sea Surface Salinity (L3, CAP, 8-Day Running Mean, Radiometer)
Monthly Imagery Layers
Aerosols (2 layers): SeaWiFS DeepBlue Aerosol Optical Thickness 550nm (Monthly); SeaWiFS DeepBlue Aerosol Angstrom Exponent (Monthly).
Sea Surface Salinity (2 layers): Sea Surface Salinity (L3, Monthly, Radiometer); Sea Surface Salinity (L3, CAP, Monthly, Radiometer,).
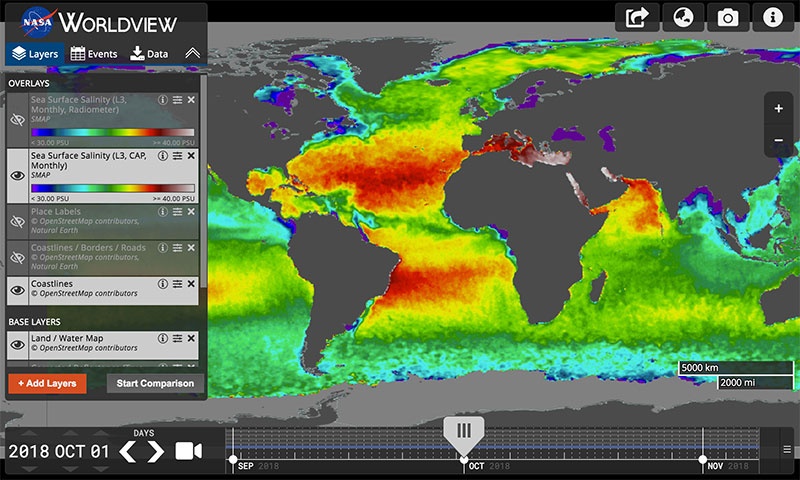
Soil Moisture Active Passive (SMAP) Sea Surface Salinity (L3, CAP, Monthly)
Modern-Era Retrospective analysis for Research and Applications, Version 2 (MERRA-2) imagery (26 layers):
- 2-meter Air Temperature
- Total Precipitation Bias Corrected
- Snowfall
- Soil Water Root Zone
- Evaporation over Land
- SO2 Column Mass Density ENSEMBLE
- Dust Surface Mass Concentration PM2.5
- Dust Surface Mass Concentration
- Total Aerosol Optical Thickness Scattering 550nm
- Total Aerosol Optical Thickness Extinction 550nm
- Total Dust Deposition, Dry+Wet All Bins
- Evaporation from Turbulence
- Surface Albedo
- Carbon Monoxide Emission ENSEMBLE
- ISCCP Cloud Albedo
- Snow Depth Over Glaciated Surface
- Incident Shortwave Over Land
- Open Water Latent Energy Flux
- Total Precipitable Water Vapor
- 2-meter Air Temperature, Assimilated
- Aerosol Optical Depth Analysis
- Surface Wind Speed
- Air Temperature at 250hPa
- Ozone Mixing Ratio at 50hPa
- Relative Humidity After Moist at 700hPa
- Convective Rainwater Source at 700hPa
Composite and Reference Layers
Socioeconomic imagery (47 layers)
- Croplands
- Pastures
- Anthropogenic Biomes
- Drought Hazard: Frequency and Distribution, Mortality Risk, Economic Risk
- Cyclone Hazard: Frequency and Distribution, Mortality Risk, Economic Risk
- Flood Hazard: Frequency and Distribution, Mortality Risk, Economic Risk
- Volcano Hazard: Frequency and Distribution, Mortality Risk, Economic Risk
- Estimated Migration by Decade: 1970-1980, 1980 -1990, 1990-2000
- Population Density: 2000, 2005, 2010, 2015, 2020
- Urban Extent; Human Footprint
- Last of the Wild
- Urban-Rural Extent Below 10m
- Particulate Matter below 2.5 micrometers 2001-2010, 2010-2012
- Mangrove Forest
- Probabilities of Urban Expansion
- Summer Day Maximum Land Surface Temperature
- Summer Night Minimum Land Surface Temperature
- Ground Level Nitrogen Dioxide 3 year running mean 1996-1998, 2010-2012
- Amphibian Richness: All Species, Vulnerable Species, Critically Endangered Species, Endangered Species, All Threats
- Mammal Richness: All Species, Vulnerable Species, Critically Endangered Species, Endangered Species, All Threats
- Human Built-up and Settlement Extent
- Impervious Surface Percentage
Land Cover (1 layer): WELD 5 Year Tree Cover
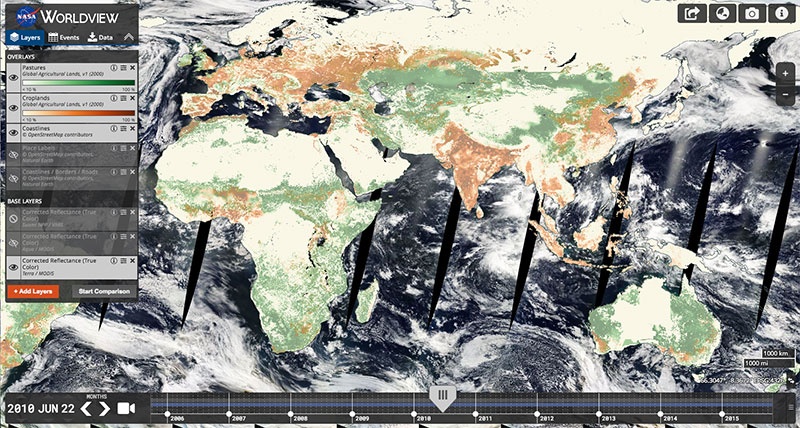
SEDAC Croplands and Pastures layers

WELD 5 year Tree Cover composite over the continental USA
Reference
Orbit Tracks (Ascending | Descending) (18 layers): Sentinel 1A, Sentinel 1B , Sentinel 2A, Sentinel 2B, Sentinel 5P, ICESat-2, MetOP-C, GCOM-C and Landsat 7.