Link to First Stage of Root Cause Analysis for CMR-9094
Document Overview
This performance analysis is based off running a 2021 production workload of search requests, examining only those requests with target format of UMM-JSON. Logs captured the milliseconds (ms) that a request takes in 2 key areas:
- Section 1 -- comparing the database fetch stage vs entire data transform stage for each request (e.g. for each 'batch' of concepts returned)
- Section 2 -- the data transformation steps for each individual concept in a 'batch', which together with other computations compose the larger data transform stage from section 1.
Measures of central tendency
- It is standard advice to use
medianinstead ofavg(mean/average) when looking at data that is highly variable with many outliers that have extreme values, as we have here. - At the same time, to some extent outliers are of interest, because the pressing question is moreso "how can we improve those requests which are slow" over improving all requests. For that reason,
avgis used alongsidemedianwhere appropriate.
Section 1 -- Fetch stage vs Transform stage per request (batch)
Total number of search events with target format UMM-JSON: 5,024
Use date 5/24/23.
Chart A - time taken in Fetch stage vs Transform stage over Num. of Concepts per search request

- Transform stage time overtakes Fetch stage as number of concepts requested grows larger
- Transform stage time median and mode significantly differ in the num_concepts range above 890 (implies skewedness)
- Fetch stage time spike in the middle is an outlier -- one single request for 252 concepts that always takes longer fetching from database across multiple workload runs. (might be worth investigating?)
Table B - Searches Grouped by Num. of Concepts Requested
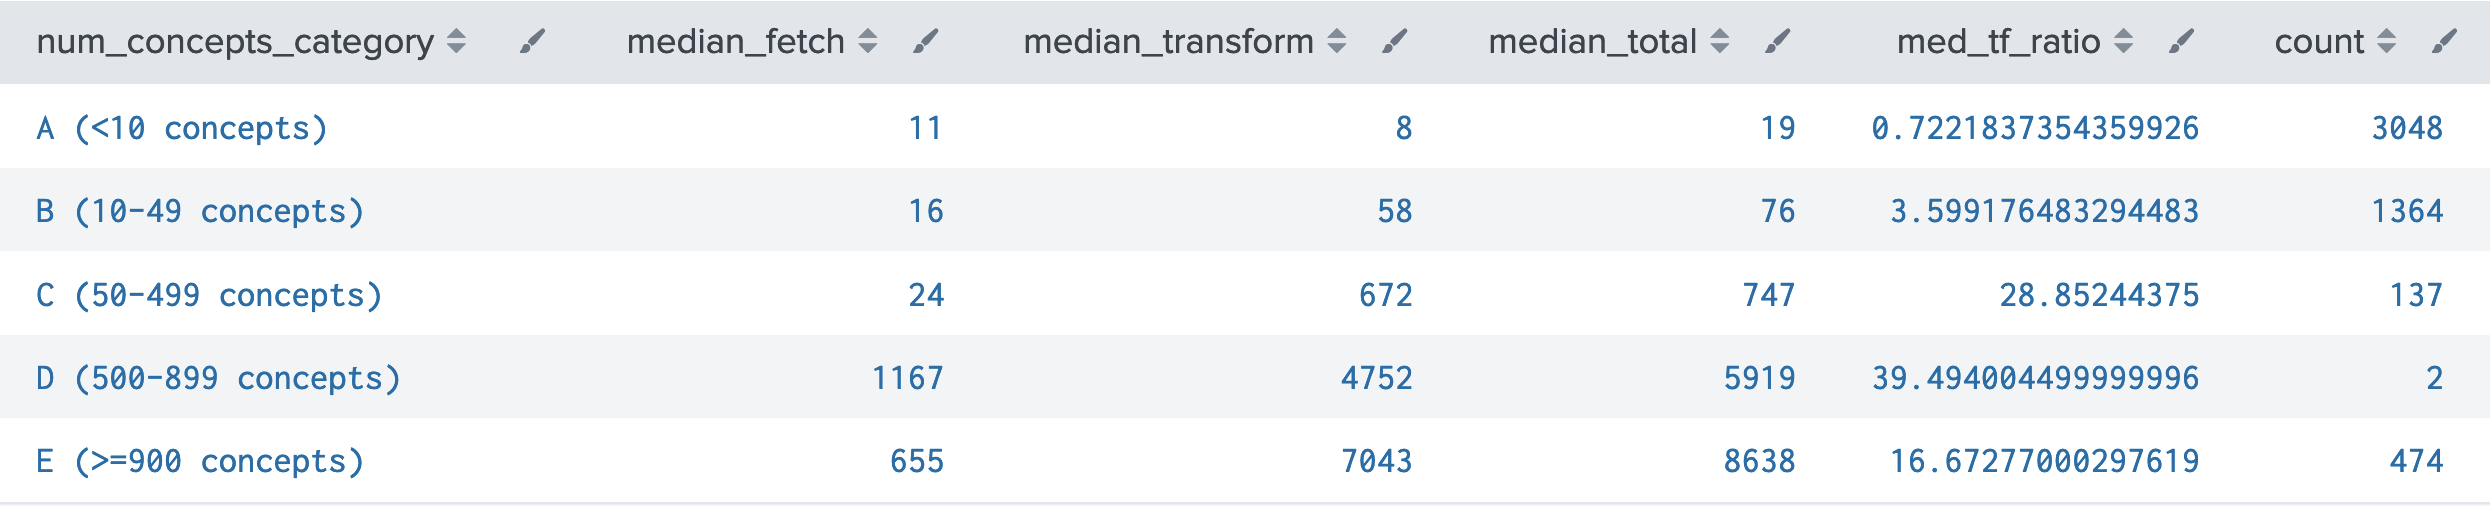
- Well over half of all UMM-JSON searches request less than 10 concepts, and another quarter request less than 50.
- As number of concepts requested increases, Transform stage takes a longer proportion of total time, and its time grows faster than that of Fetch stage.
- The '500-899 concepts' category is very small (insignificant), which likely explains its funky values.
Table C - Time Per Concept Returned

- Fetch time per concept steadily decreases as number of concepts requested increases. When number of concepts is <50, we see wildly higher means than medians, which implies there are extreme outliers on the slow end.
- Transform time per concept stays stable at around 6 ms regardless of number of concepts requested, except for those requests <10 concepts which again show a higher mean. (relevant in section 2)
Section 2 -- Per concept transformation times
The entire transform stage for 1 request consists of: mapping over the batch of concepts, for each one selecting a transformation strategy, executing it, and attaching the result to the concept. For UMM-JSON, the relevant transformation strategies are "umm-lib" (granules only) and "migrate-umm" (for when both target format and original format are both UMM-JSON); their execution was timed.
:migrate-umm transformation (umm to umm only)
This transformation has one step, the migration from the original UMM-JSON version to the desired version. The version field indicates the original version.
Total events (each one concept): 455,188
Table D

(only top of table shown, sorted desc by median_migrate in order to show the 5 out of 27 versions with non-1 medians)
- Median and mode the same almost across the board, just a couple versions showing different values
- It is possible that the 'slower' versions here are due to random aberration, because:
- 1 - previous investigations failed to observe a consistent difference in speed between UMM versions
- 2 - the migrate-umm function's docstring: "Migrating across versions is just reducing over the discrete steps between each version."
:umm-lib transformation (granules only)
This transformation has 2 steps: parsing the original metadata, and generating the UMM-JSON version. The 'mime_type' is the format of the original metadata.
Total events (each one concept): 328,434
Table E

- Echo10 makes up the grand majority of concepts processed. ISO is consistently slowest (with median also being 10) but is so rare that it doesn't matter.
- Are the two umm-json formats supposed to be here? Or should they have the migrate-umm strategy?
- All non-ISO medians are 1-2 ms (not pictured), implying extreme outliers, and all have a standard deviation around 20-24 ms.
Table E further analysis with supplementary table variants E1, E2
- Does the slower subset from Table E represent an opportunity for optimization? Consider that Table C showed total transform-per-concept time to have strong centrality around 6 ms for all but the smallest requests (<10 concepts). The question is then, do the slower parse/generate events "belong to" those smaller search requests? (That would be problematic because the <10 search requests are the not the slow ones needing optimization.)
Here are 2 variants on these tables adjusted to 'zoom in' on subsets, to see if they have the possibility of significant overlap. (feedback welcome)

-

- COMING SOON – analysis utilizing additional logs to connect transform steps with num_concepts of parent request
Overview
Content Tools