The GIBS imagery archive includes approximately 90 imagery products representing visualized science data from the NASA Earth Observing System. Each imagery product is generated at the native resolution of the source data to provide "full resolution" visualizations of a science parameter. GIBS works closely with the science teams to identify the appropriate data range and color mappings, where appropriate, to provide the best quality imagery to the Earth science community. Many GIBS imagery products are generated by the EOSDIS LANCE near real-time processing system resulting in imagery available in GIBS within 3.5 hours of observation. These products and others may also extend from present to the beginning of the satellite mission. In addition, GIBS makes available supporting imagery layers such as data/no-data, water masks, orbit tracks, and graticules to improve imagery usage.
The GIBS team is actively engaging the NASA EOSDIS data centers to add more imagery products and to extend their coverage throughout the life of the mission. The remainder of this page provides a structured view of the layers currently available within GIBS grouped by science discipline and science observation. For information regarding how to access these products through the GIBS API, refer to the Access Methods section of this wiki. For information regarding how to access these products through an existing GIS/mapping client, refer to the Supported Clients section of this wiki. If you are aware of a science parameter that you would like to see visualized, please contact us at support@earthdata.nasa.gov.
As noted above, imagery products within GIBS are generated based on near real-time and standard science products. To understand the difference between these two data products, review the following page: MODIS Near Real-Time vs Science Quality.
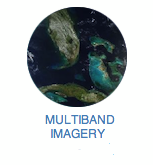
Multiband Imagery
Multiband imagery are visible products that have been created through a process of mapping one or more spectral bands to RGB composite image. Based on the selection of spectral band "combinations" and how they are mapped to the RGB visible bands, different observations will be made more apparent. As an example, the MODIS instrument has 7 spectral bands that are typically used to generate a visible image. There are 210 non-repeating band combinations that can be generated. As such, GIBS works with its imagery providers to select the "highest value" band combinations for visualization. The following tables identify the existing multiband imagery available in GIBS:
[1] This layer is a single composite of data from nine days in April 2012 and 13 days in October 2012. It does not vary over time.
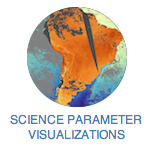
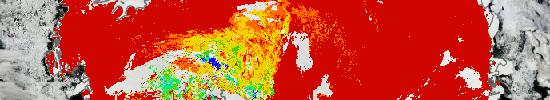
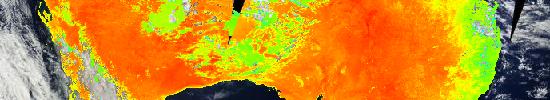
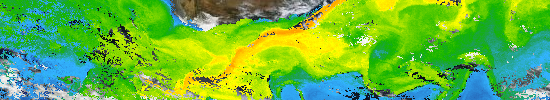
Science Parameter Visualizations
Science parameter visualizations are generated by mapping scientific measurements into an RGB image. Each measured value, or range of values, is assigned a unique color to create a visual representation of the underlying data values. This may also apply to classification data. Choose one of the following science disciplines, or scroll down, to view the imagery products available within GIBS.
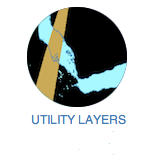
While viewing an the previous multiband and science parameter visualization layers, GIBS offers the following "utility' layers to improve imagery viewability. These layers include data or imagery masks that highlight or remove specific regions of an image and also mapping aides such as graticules and coastlines. The following tables identify the existing utility layers within GIBS:
[2] This is a static layer and does not change over time.
[3] This value refers to the resolution of the imagery. In many cases the actual instrument or measurement resolution is coarser.
[4] The Geographic projection is WGS84 latitude/longitude, EPSG:4326. The north Polar projection is NSIDC Sea Ice Polar Stereographic North, EPSG:3413. The south Polar projection is Antarctic Polar Stereographic, EPSG:3031.