What does the red line around 0 km in the CALIOP backscatter profile mean? Is the pseudo pillar on the right the eruption? Is the feature at 15 km some sort of cloud. I am asking because this image could be a good CALIOP story with the proper words around it. It looks as if CALIOP was getting a great view according to the orbit track.
The Red line is the ground level from the Digital Elevation Map. The feature near 15 km, centered around 16 S, coincide with enhanced SO2 levels observed by IASI. The height of the SO2 plume seen by IASI is shown
on the map (right figure). There is a good agreement between both instruments and this indicate the presence of So2 and particulate matters at those levels (15-18 km). The depolarization and color ratio (not shown) values of the feature observed by CALIPSO indicate the presence of ash or ice or both. It's still unclear ...
That cloud does look much like a cirrus, as J-P noted. Considering its altitude and substantial optical depth, there should be appreciable positive absorbing AI if it contains ash. But none of the UVAI instruments (GOME 2, OMI, OMPS) show any AI at all at that location. So it seems ice might be the best explanation.
Thanks Mike. That's really interesting..I'll try to run trajectories from CALIOP to improve the comparison with IASI and make sure that those ice layers and the SO2 clouds are collocated.
Both of the above trace back to Aoba within a day of 5 April.
Here's an oddball. Extensive (20S-40S), non-depolarizing UTLS layer over Eastern Australia on 11 April. Back trajectories from a point in the middle (30S) do NOT trace to the volcano; the winds are strictly westerlies back 6 days. Don't know the source, but this could make Aoba-aerosol attribution challenging. The tiny non-depolarizing feature above cloud at 17S does trace back to the volcano area. https://tinyurl.com/nondepol-20S-40S-11Apr
Top. Mean Scattering Ratio (SR defined as Total backscatter/Molecular backscatter) between 15-20 km derived from CALIOP between 3 and 13 April. Data with depolarization greater than 5% are removed to keep only non-depolarizing layers (liquid sulfate). Bottom. Zonal mean Scattering Ratio calculated during the same period.
Comment: Mike: The non-depolarizing layers you pointed on the CALIOP browse images show up on this map over Australia and the Tasman Sea. If the backtrajectories do not trace back the plumes to the Aoba eruption, maybe it could be from Sinabung ? But the extension of the plume seen on the zonal cross-section is consistent with an eruption in the Southern Tropics, so likely from Aoba.
You deserved a little more info than I presented before, so I've whipped up a ppt (I hope I uploaded it successfully).
You'll see the path those midlatitude parcels took, and another CALIPSO curtain along the path.
It looks to me that there are sulfates from more than one eruption/volcano blowing around that part of the globe. I think that if we're gonna attribute aerosols to a specific eruption we'll need to stay as close to the L2 data as possible.
Aura/MLS data might provide some useful insight into the origin of the sulfate aerosol layers. There was another fairly large eruption/emission from Aoba on March 25-26; smaller than the April 5 eruption, but MLS did detect an isolated spot of UTLS SO2 over N. Australia in late March (see profile and map below). Then a larger UTLS SO2 injection associated with the April 5 eruption.
The activity starting on 24 March is actually very interesting. By looking at Himawari data we have noticed at least 7 quite large bursts perhaps reaching ~9 km and detectable in the 7.3 µm channel. This really highlights the usefulness of a geo instrument because some of these bursts could be missed by the polar orbiters. Each of these bursts look like ~0.02-0.05 Tg(SO2) so in total (7 bursts) this is actually quite a lot of SO2. The emissions travel eastwards and then northwards - the strength of the meridional flow was surprising to me but maybe not to an expert in tropical meteorology. I haven't looked, but I suspect MLS might (depends on coincidence of the nadir trace) see something east of Ambae (>170 E) and north (>10S). Caliop might also see something. It is also interesting to compare the OMI/GOME retrievals for that period because the low level SO2 (not seen by Himawari 7.3 µm) moves in a different direction and also looks like significant emissions. We will post the animations soon.
Please see another example of meridional transport of sulfates, into the extratropics, from the Aoba neighborhood...this time the ~5 April period is in play. Wild stuff.
...I've done an ad hoc, eyeball survey of CALIPSO non-depolarizing UTLS layers in the days since 5 April. Some were reported above. But the included document expands on this to show CALIOP curtains and trajectories out to 23 April, when aerosols seemed to have traveled to Madagascar longitudes on westerlies, i.e. from Pacific to Atlantic to there. The point is that there definitely seems to be a lot of sulfate observations in the SH tropics and extratropics, many can be traced to 5 April, others definitely not. And some of those disparate observations are on adjacent CALIPSO orbits!
The sulfate layer you pointed out in your document near Madagascar on April, 23th is also an interesting feature for our French Colleague from Reunion Island who have a ground-based lidar close by. They might be able to see something.
Further to Mike's analysis, here are some plots of the SO2 emissions (not sulphate) from AIRS for emissions from 4-10 April and from 22 March to 10 April. The plots show mass (kt) in each AIRS pixel (averaged where there are overlapping pixels) based on about 500 granules. Transport is quite complex and there is certainly a hint that meridional transport is happening. Lack of sensitivity, conversion and other interference means that AIRS is not seeing the whole picture.
According to an email discussion between Fred Prata, Simone Tilmes , Ulrike Niemeier and myself , NCAR and MPI-M will do some global aerosol simulations with the following emission profile:
              Eruption start: 0180405 14 UTC ,
              Eruption end: 20180405 16.10 UTC ,
              Eruption duration: 2 hours  10 min,
              Mass: 0.12 Tg SO2,
              Altitudes:  16 to 18 km,
              Latitude:  -15.4,
              Longitude: 167.83 E;
I have run our WACCM model (1deg horiz. resolutions) with the information posted by Claudia (for April 5th eruption) and here is a movie of SO2 at 85hPa and 100hPa. For the run, I am using GEOS5 meteorological analysis. It would be interesting to see how this compares to other models and data:
Thanks, modelers, for your great animations of SO2 and SO4. These are potentially ideal for making comparisons with remote sensing observations. I've been building a strategy for doing the comparisons and presenting the results, but I think I need some help so that the effort of comparing model-to-model, and model-to-observation is as streamlined as possible. As it stands, it takes a lot of manual effort.
This ppt has a small set of maps, notes, and questions for this group to ponder. In a nutshell, what I hope we can do is to agree on some standards for mapping SO2 and SO4 to make map-matching "plug and play."
Thoughts?
All the best,
mikef
P.S. My goal is to survey CALIPSO and ground-based lidar to examine 4 conditions, two where models and observations agree (1. no sulfate in either 2. sulfate in both), and two where there is disagreement (1. model yes, observation no; 2. model no, observation yes)
Also, What I think could be useful for this comparison exercise is to extract model data along satellite observations. Valentina suggested a kind of satellite simulator which could be applied to the model output. To start with, simple files with orbit information (Lat, Lon, Time) from CALIPSO could be produced to extract vertical profile of different parameters from the model.
It can simulate CloudSat/CALIPSO observations based on model output. This could be a great tool for comparing simulated eruptions with actual satellite observations.
for potential comparison with data, I produced a plot showing modeled SO2, SO4 and OH values following the volcanic plume. For that, I simply searched for the SO2 maximum value each time step in the region of the eruption and plotted corresponding SO4 values. This can be certainly refined and I could produce a regional average over some threshold value. Maybe it is possible to get those information out of the data and compare to the models?
37 Comments
Jean-Paul Vernier
HIMAWARI-8 animation of cloud top temperature at 11 micron. Processed by K. Bedka. Credit JAM.
Unknown User (fprata)
Himawari-8 11 micron bightness temperatures (K) 5 April 2018
Unknown User (fprata)
Himawari-8 High-level SO2 loop for Ambae on 5 April 2018 (Processed by Andrew Prata)
Unknown User (fprata)
Mass eruption rate determined from Himawari-8 10 minute imagery on 5 April 2018.
Method assumes radial spreading of umbrella cloud with r^3/t^2 = constant.
I have a short document describing the derivation of the MER from Himawari-8. Available on request from: fred_prata@hotmail.com
Jean-Paul Vernier
Thanks Fred. Is this the mass eruption rate of SO2 ?
What's the total injection mass ?
Unknown User (fprata)
AIRS retrievals
Unknown User (fprata)
Himawari-8 SO2 retrieval (more plots available - just ask)
Unknown User (fprata)
Nice map of Ambae showing the volcanic lake and Lombenben volcano
Unknown User (fprata)
Radiosonde profiles from Nadi (Fiji) and Noumea (New Caledonia) at 12 Z on 5 April (Data courtesy: U. of Wyoming)
Jean-Paul Vernier
IASI/Meteop on 08042018 at 22:00 UTC and CALIOP/backscatter profile 4 hours later. Credit Lieven Clarisse.
user-ffeb7
What does the red line around 0 km in the CALIOP backscatter profile mean? Is the pseudo pillar on the right the eruption? Is the feature at 15 km some sort of cloud. I am asking because this image could be a good CALIOP story with the proper words around it. It looks as if CALIOP was getting a great view according to the orbit track.
Jean-Paul Vernier
The Red line is the ground level from the Digital Elevation Map. The feature near 15 km, centered around 16 S, coincide with enhanced SO2 levels observed by IASI. The height of the SO2 plume seen by IASI is shown
on the map (right figure). There is a good agreement between both instruments and this indicate the presence of So2 and particulate matters at those levels (15-18 km). The depolarization and color ratio (not shown) values of the feature observed by CALIPSO indicate the presence of ash or ice or both. It's still unclear ...
user-dccbf
That cloud does look much like a cirrus, as J-P noted. Considering its altitude and substantial optical depth, there should be appreciable positive absorbing AI if it contains ash. But none of the UVAI instruments (GOME 2, OMI, OMPS) show any AI at all at that location. So it seems ice might be the best explanation.
Jean-Paul Vernier
Thanks Mike. That's really interesting..I'll try to run trajectories from CALIOP to improve the comparison with IASI and make sure that those ice layers and the SO2 clouds are collocated.
user-dccbf
Here are a couple of additional CALIPSO curtains showing what I think are sulfate layers (some backscatter but no apparent depol. ratio).
Both of the above trace back to Aoba within a day of 5 April.
Here's an oddball. Extensive (20S-40S), non-depolarizing UTLS layer over Eastern Australia on 11 April. Back trajectories from a point in the middle (30S) do NOT trace to the volcano; the winds are strictly westerlies back 6 days. Don't know the source, but this could make Aoba-aerosol attribution challenging. The tiny non-depolarizing feature above cloud at 17S does trace back to the volcano area.
https://tinyurl.com/nondepol-20S-40S-11Apr
Jean-Paul Vernier
Top. Mean Scattering Ratio (SR defined as Total backscatter/Molecular backscatter) between 15-20 km derived from CALIOP between 3 and 13 April. Data with depolarization greater than 5% are removed to keep only non-depolarizing layers (liquid sulfate). Bottom. Zonal mean Scattering Ratio calculated during the same period.
Comment: Mike: The non-depolarizing layers you pointed on the CALIOP browse images show up on this map over Australia and the Tasman Sea. If the backtrajectories do not trace back the plumes to the Aoba eruption, maybe it could be from Sinabung ? But the extension of the plume seen on the zonal cross-section is consistent with an eruption in the Southern Tropics, so likely from Aoba.
user-dccbf
Hi all,
You deserved a little more info than I presented before, so I've whipped up a ppt (I hope I uploaded it successfully).
You'll see the path those midlatitude parcels took, and another CALIPSO curtain along the path.
It looks to me that there are sulfates from more than one eruption/volcano blowing around that part of the globe. I think that if we're gonna attribute aerosols to a specific eruption we'll need to stay as close to the L2 data as possible.
Simon Carn
Hi all,
Aura/MLS data might provide some useful insight into the origin of the sulfate aerosol layers. There was another fairly large eruption/emission from Aoba on March 25-26; smaller than the April 5 eruption, but MLS did detect an isolated spot of UTLS SO2 over N. Australia in late March (see profile and map below). Then a larger UTLS SO2 injection associated with the April 5 eruption.
Unknown User (fprata)
The activity starting on 24 March is actually very interesting. By looking at Himawari data we have noticed at least 7 quite large bursts perhaps reaching ~9 km and detectable in the 7.3 µm channel. This really highlights the usefulness of a geo instrument because some of these bursts could be missed by the polar orbiters. Each of these bursts look like ~0.02-0.05 Tg(SO2) so in total (7 bursts) this is actually quite a lot of SO2. The emissions travel eastwards and then northwards - the strength of the meridional flow was surprising to me but maybe not to an expert in tropical meteorology. I haven't looked, but I suspect MLS might (depends on coincidence of the nadir trace) see something east of Ambae (>170 E) and north (>10S). Caliop might also see something. It is also interesting to compare the OMI/GOME retrievals for that period because the low level SO2 (not seen by Himawari 7.3 µm) moves in a different direction and also looks like significant emissions. We will post the animations soon.
user-dccbf
Hi all,
Please see another example of meridional transport of sulfates, into the extratropics, from the Aoba neighborhood...this time the ~5 April period is in play. Wild stuff.
mikef
Ross Bagwell
Submitted for Ralph Kahn:
MISR Aoba Volcano Stereo-derived Plume-Height Map, 15 March 2018
user-dccbf
Hi all,
For your consideration...
...I've done an ad hoc, eyeball survey of CALIPSO non-depolarizing UTLS layers in the days since 5 April. Some were reported above. But the included document expands on this to show CALIOP curtains and trajectories out to 23 April, when aerosols seemed to have traveled to Madagascar longitudes on westerlies, i.e. from Pacific to Atlantic to there. The point is that there definitely seems to be a lot of sulfate observations in the SH tropics and extratropics, many can be traced to 5 April, others definitely not. And some of those disparate observations are on adjacent CALIPSO orbits!
Jean-Paul Vernier
Thanks Mike.
The sulfate layer you pointed out in your document near Madagascar on April, 23th is also an interesting feature for our French Colleague from Reunion Island who have a ground-based lidar close by. They might be able to see something.
https://www-calipso.larc.nasa.gov/products/lidar/browse_images/show_detail.php?s=expedited&v=V3-30&browse_date=2018-04-23&orbit_time=21-00-00&page=4&granule_name=CAL_LID_L1_Exp-Prov-V3-40.2018-04-23T21-00-00Z.hdf
Unknown User (fprata)
Further to Mike's analysis, here are some plots of the SO2 emissions (not sulphate) from AIRS for emissions from 4-10 April and from 22 March to 10 April. The plots show mass (kt) in each AIRS pixel (averaged where there are overlapping pixels) based on about 500 granules. Transport is quite complex and there is certainly a hint that meridional transport is happening. Lack of sensitivity, conversion and other interference means that AIRS is not seeing the whole picture.
user-e36d9
According to an email discussion between Fred Prata, Simone Tilmes , Ulrike Niemeier and myself , NCAR and MPI-M will do some global aerosol simulations with the following emission profile:
Eruption start: 0180405 14 UTC , Eruption end: 20180405 16.10 UTC , Eruption duration: 2 hours 10 min, Mass: 0.12 Tg SO2, Altitudes: 16 to 18 km, Latitude: -15.4, Longitude: 167.83 E;user-dccbf
Claudia, do you mean "0405" (5 April) instead?
mikef
user-e36d9
Mike , yes, of course, thanks for the hint It is correct now CT
Simone Tilmes
I have run our WACCM model (1deg horiz. resolutions) with the information posted by Claudia (for April 5th eruption) and here is a movie of SO2 at 85hPa and 100hPa. For the run, I am using GEOS5 meteorological analysis. It would be interesting to see how this compares to other models and data:
Jean-Paul Vernier
Hello Simone,
Thanks.It would be also interesting to have sulfate aerosol concentration at those levels.
Jean-Paul
Valentina Aquila
Hi Simone, I've just joined this wiki and caught up with this thread. I can set up a GEOS-5 simulation tomorrow using the values that Claudia posted.
Jean-Paul Vernier
Hello Simone,
We are talking about your simulation. Would you be available to put your aerosol simulation online ?
Thanks.
Simone Tilmes
Hi, yes, here is sulfate (SO4) in mass mixing rations (10-6 kg/kg):
user-773e0
This are result of ECHAM5-HAM for SO2 and sulfate.The model runs with nudged QBO.
Ulrike
user-dccbf
Hello all,
Thanks, modelers, for your great animations of SO2 and SO4. These are potentially ideal for making comparisons with remote sensing observations. I've been building a strategy for doing the comparisons and presenting the results, but I think I need some help so that the effort of comparing model-to-model, and model-to-observation is as streamlined as possible. As it stands, it takes a lot of manual effort.
This ppt has a small set of maps, notes, and questions for this group to ponder. In a nutshell, what I hope we can do is to agree on some standards for mapping SO2 and SO4 to make map-matching "plug and play."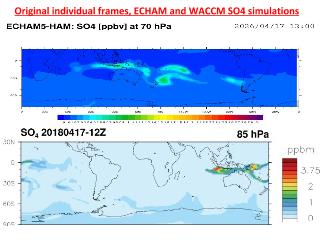
Thoughts?
All the best,
mikef
P.S. My goal is to survey CALIPSO and ground-based lidar to examine 4 conditions, two where models and observations agree (1. no sulfate in either 2. sulfate in both), and two where there is disagreement (1. model yes, observation no; 2. model no, observation yes)
Jean-Paul Vernier
Hello Mike,
Also, What I think could be useful for this comparison exercise is to extract model data along satellite observations. Valentina suggested a kind of satellite simulator which could be applied to the model output. To start with, simple files with orbit information (Lat, Lon, Time) from CALIPSO could be produced to extract vertical profile of different parameters from the model.
Jean-Paul
Simon Carn
Hi all,
For a satellite data simulator, the CFMIP Observational Simulator Package (COSP) might be worth exploring: https://www.earthsystemcog.org/projects/cfmip/cosp
It can simulate CloudSat/CALIPSO observations based on model output. This could be a great tool for comparing simulated eruptions with actual satellite observations.
The COSP source code is available here: https://code.google.com/archive/p/cfmip-obs-sim/
-Simon
Simone Tilmes
Hi all,
for potential comparison with data, I produced a plot showing modeled SO2, SO4 and OH values following the volcanic plume. For that, I simply searched for the SO2 maximum value each time step in the region of the eruption and plotted corresponding SO4 values. This can be certainly refined and I could produce a regional average over some threshold value. Maybe it is possible to get those information out of the data and compare to the models?
Simone