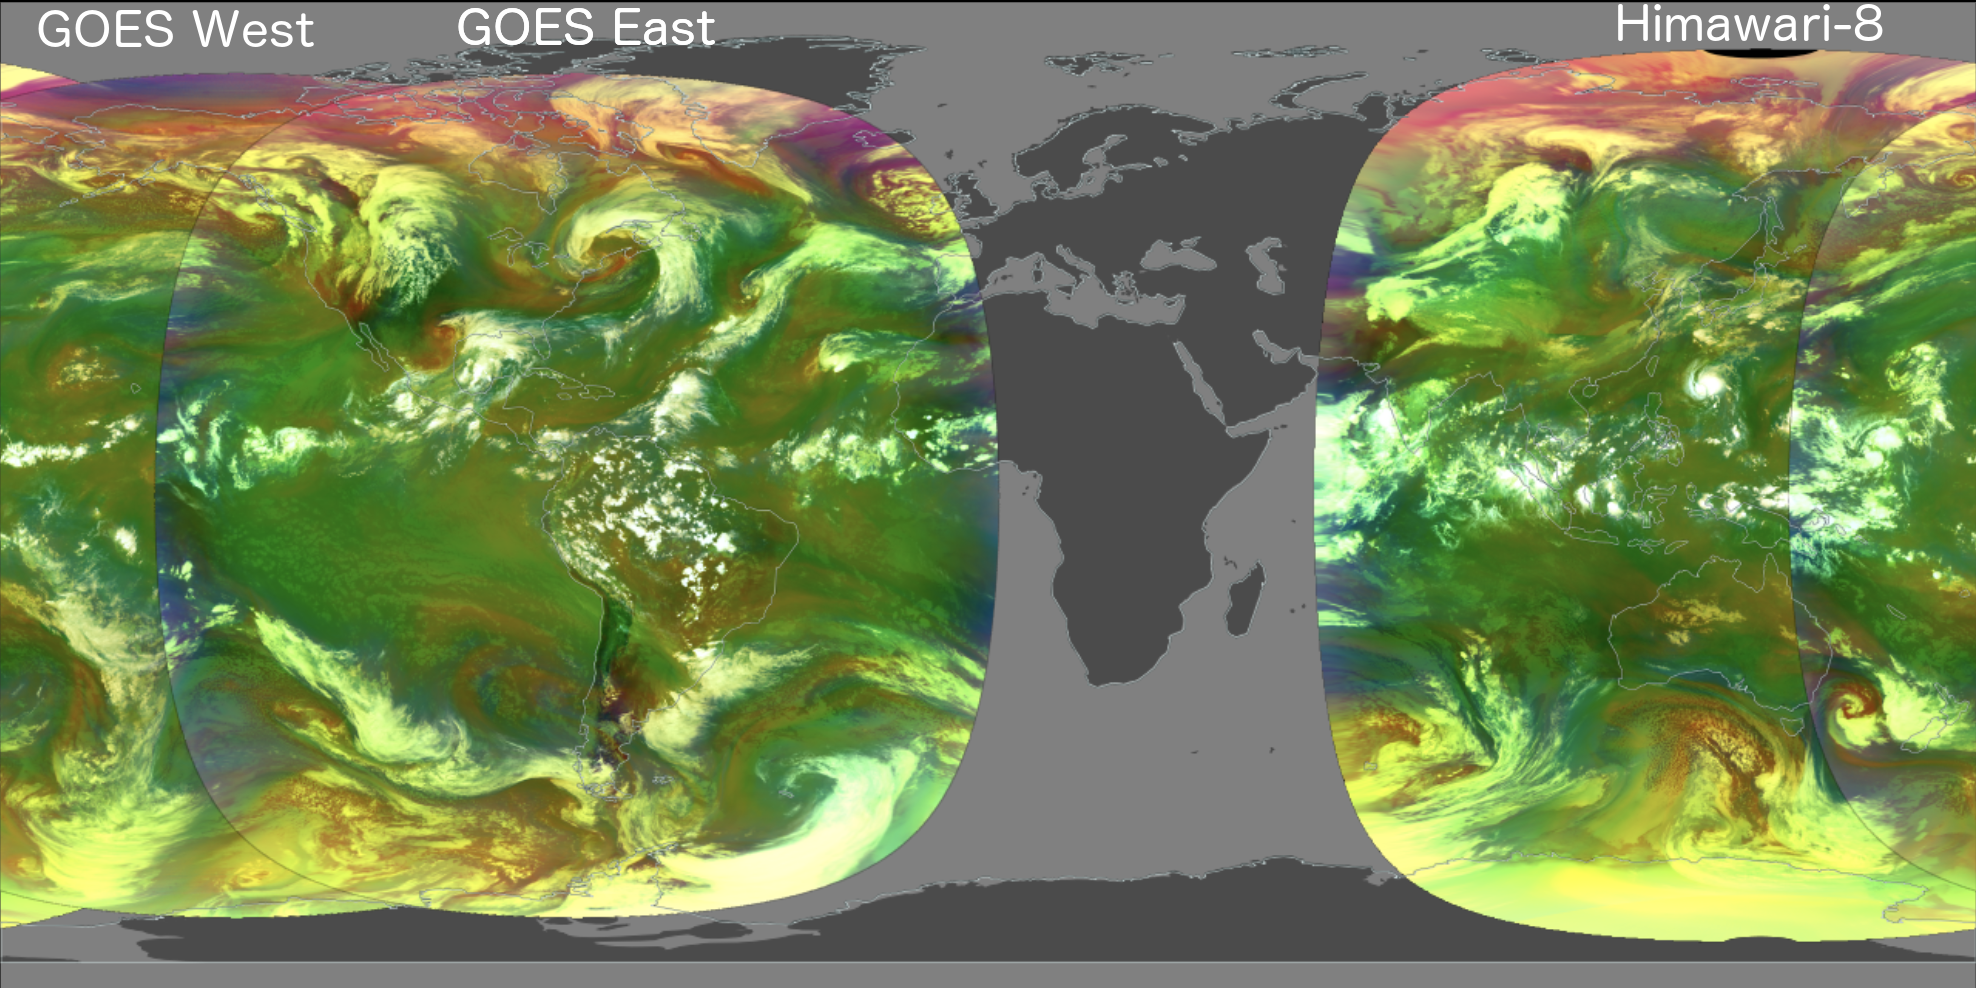
We've been faithfully providing daily global imagery from MODIS, VIIRS, and other instruments for the last 7+ years and we're now entering new territory - we're going to provide a rolling month of geostationary imagery from GOES-East, GOES-West and Himawari-8.
That's imagery available at 10 MINUTE increments for the last month!
Our current offerings will be Red Visible, Clean Infrared and Air Mass. We may add more in the future, or provide higher resolution versions of this imagery - keep an eye on the blog for any updates! In particular, the Red Visible layer is currently being displayed at 1km spatial resolution but may be available at its native 500m in the future.
See Geostationary Imagery in Action
Step 1: Load Geostationary Imagery
Open Worldview's latest release (v.3.2.0): https://worldview.earthdata.nasa.gov
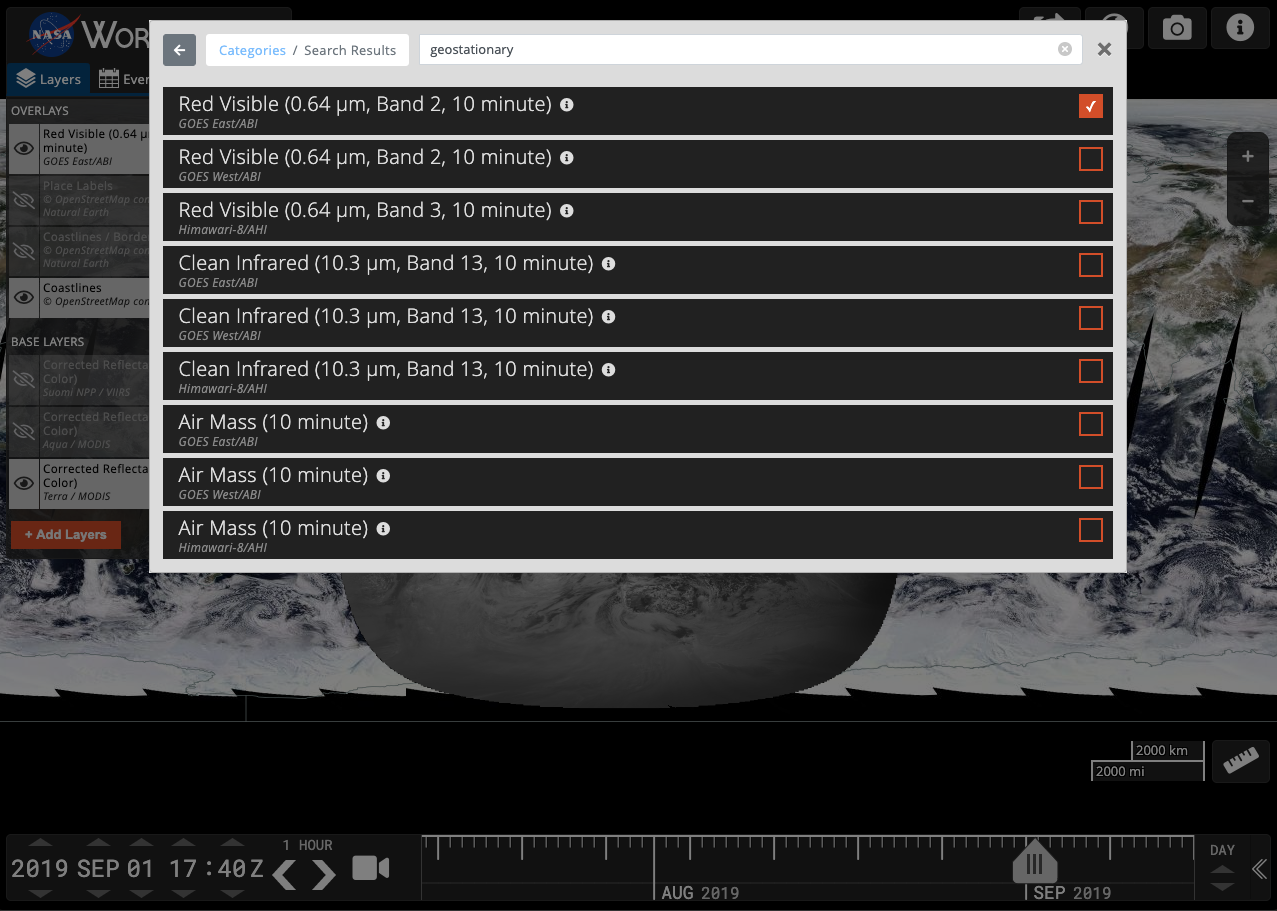
- Click on "+ Add Layers" button at the bottom of the Layer List.
- Select the "Featured" tab and select "Geostationary"; alternatively, type in "Geostationary" in the search box.
- Select one of the available layers such as "Red Visible (0.64um, Band 2, 10 minute) GOES East/ABI".
 GOES East/ABI Full Disk loaded in Worldview")
Step 2: Set Up Timeline
- Note the change in the timeline! You can now see the Year, Month, Day AND the time in Hours and Minutes Z (Zulu Time which is equivalent to UTC - Coordinated Universal Time) on the left side of the timeline.
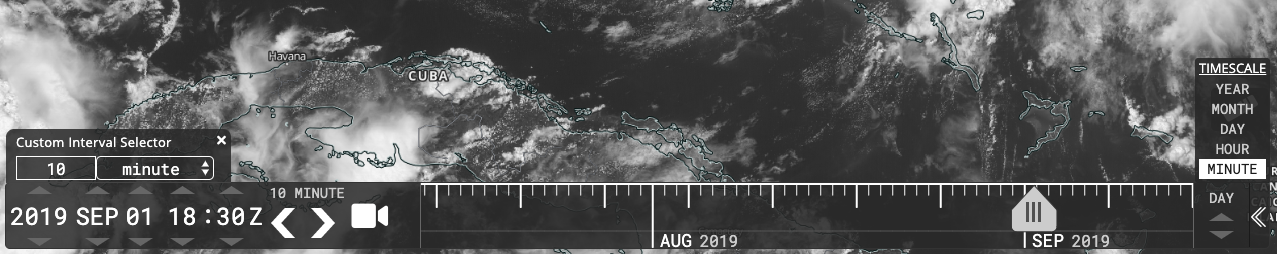
- To the right of the "Z" are the < > increment arrows. Click on "1 Day" above these to change the increment. There are several options - Year, Month, Day, Hour, Minute and Custom. Click on Custom and in the Custom Interval Selector box, change the increment to "10" and "Minute". (This imagery is available in 10 minute increments starting at 00:00)
- Click on "Day" on the right side of the timeline to change the timescale to "Minute" or "Hour".
TIP: The geostationary imagery from GOES-East, GOES-West and Himawari-8 is available in 10 minute increments starting at 00:00.
Step 3: View Geostationary Imagery and Step Through Time!
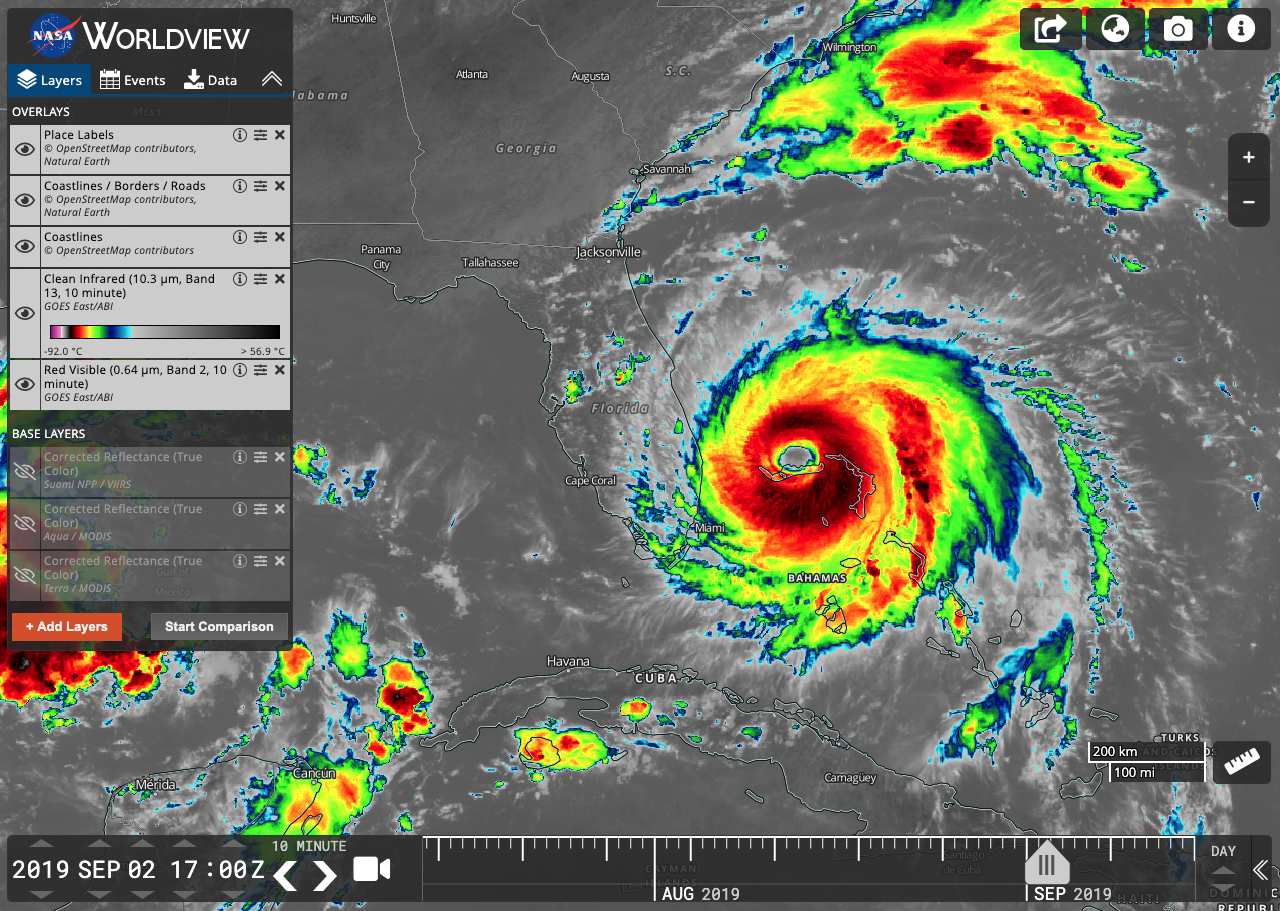
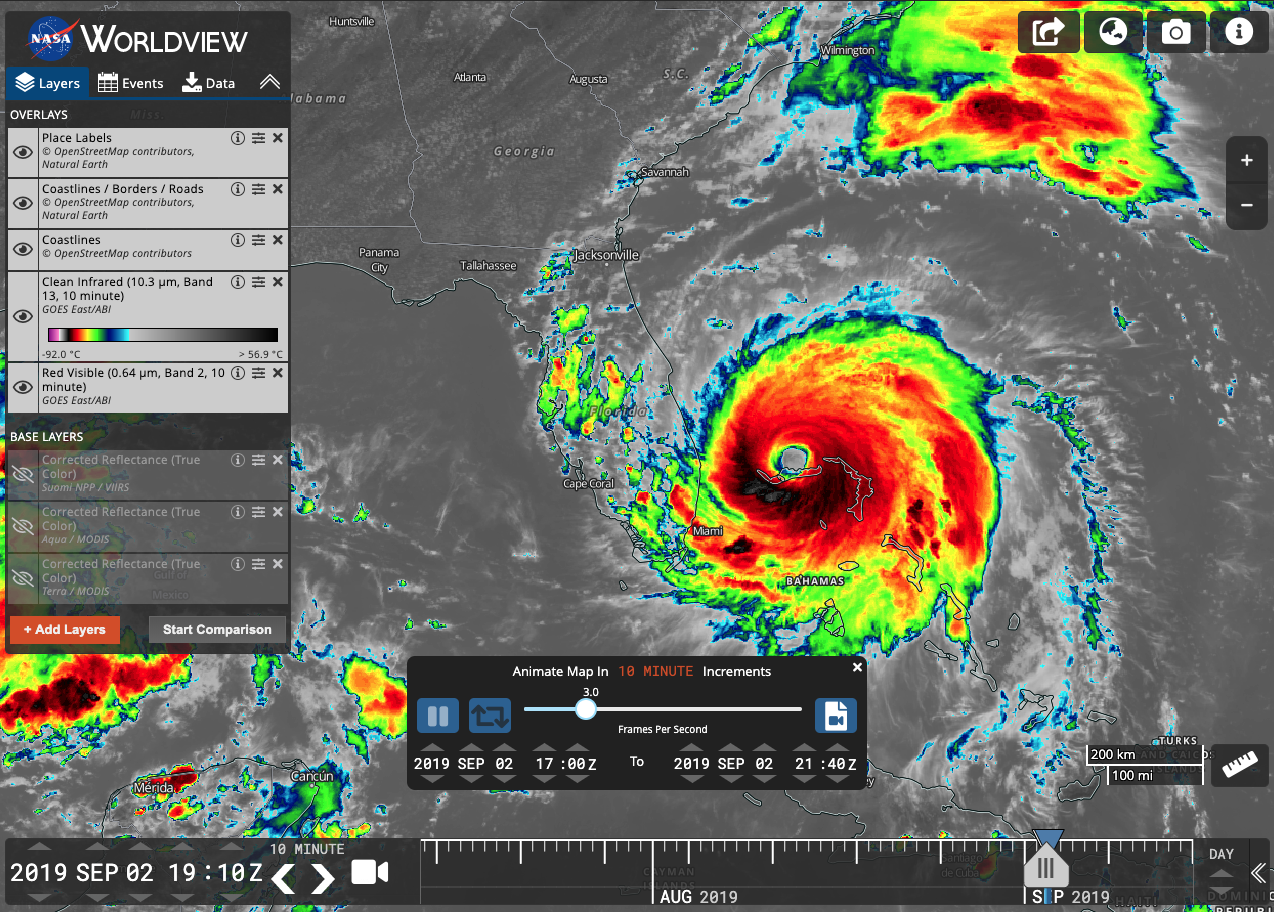
- Enter 2019 SEP 02 17:00 Z in the timeline.
- The GOES-East disk will update to the new date and time and show a greyscale image.
- Zoom into the Bahamas/Florida. Here you can see Hurricane Dorian the day after it made landfall on the Bahamas.
- Add another layer such as "Clean Infrared (10.3 um, Band 13, 10 minute)"
- Click on the forward increment arrow to see the image change at 10 minute increments. The change will be almost imperceptible as the imagery is loading. Click on the back arrow several times to cache the imagery and click on the forward arrow again, you will be able to see the storm's rotation.
TIP: The Red Visible layer is only available during the daytime; the Clean Infrared and Air Mass layers are available all day!
Step 4: Set Up Animation
- To make it even easier to watch the storm's progression, set up an animation!
- Click on the Video Camera icon in the timeline.
- Set the second date and time fields to 2019 SEP 02 21:00 Z; set the first date and time fields to 2019 SEP 02 17:00 Z.
- Click on the "Play" button and watch the storm move!
- Click on the "Create Animated GIF" icon on the right to download an animated GIF of the animation, like below:
Check out our latest Worldview tour story that shows off the geostationary imagery - Hurricane Dorian (September 2019)
Read more about Geostationary imagery on the Earthdata website - Now Available in Worldview: Earth Every 10 Minutes
and MOST IMPORTANTLY, get started with geostationary imagery in Worldview!
As always, if you have any comments or feedback, contact us at support@earthdata.nasa.gov
PS: geostationary imagery isn't just for hurricanes and clouds! Here's an example showing a recent fire in northern California combining red band imagery from GOES-West with fires and thermal anomalies from Suomi NPP / VIIRS over the morning of 2019-10-27:

Overview
Content Tools