Working with Multi-Dimensional Data in a GIS
NASA distributes scientific data in a variety of file formats, including Network Common Data Form (netCDF), Hierarchical Data Format (HDF), and Gridded Binary (GRIB). These file formats are optimized for storing multidimensional scientific data and the associated metadata. A Multidimensional Raster can have spatial, temporal, and vertical dimensions. You can think of this as the three dimensions of a cube with x, y, and z coordinates or as four dimensions adding in a temporal component with x, y, z, and t coordinates. GIS workflows have typically dealt only with two-dimensional data; however with the addition of multidimensional tools in many GIS programs, such as ArcGIS or QGIS, there is now support for these multidimensional formats which allows for scientific data management and analysis.
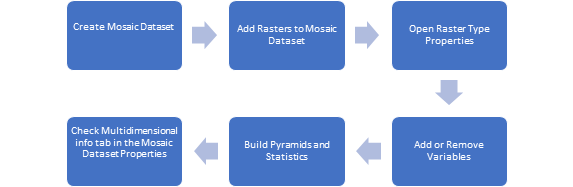
There are two ways to make a mosaic dataset that is multidimensional-aware. You can create a mosaic dataset by adding rasters using HDF, netCDF, or GRIB raster file types which will import dimensional data and variable information into the mosaic dataset. The other option is to build out multidimensional information table in order to generate required multidimensional fields, metadata, and structure to make the dataset multidimensional-aware. In order to do this you will need to have a field in your mosaic dataset footprint table that identifies the variable in each raster and there needs to be either a time or height field to define one or more dimensions
Mosaic datasets can manage one or multiple variables in ArcGIS Pro. Whether you should put all variables in one mosaic dataset or create one mosaic dataset per variable depends on the application.
- If your application only uses one variable, or a few independent variables, one mosaic per variable is easy to create, use, and manage.
- If your application involves computing from multiple variables using a raster function template, you need to add all the variables used by the template in one mosaic.
- If you want to serve scientific data and want to minimize the number of services, you can add multiple variables to a mosaic and use the variable selector template to access each variable.
netCDF and HDF
Some netCDF or HDF data stores its geolocation as irregularly spaced arrays. When adding to a mosaic dataset, the data is automatically converted to square pixels for display purposes only. The cell size is estimated, but users can change this in addition to setting an interpolation method. Supported interpolation methods include:
- Nearest Neighbor
- Bilinear
- Linear Tinning
- Natural Neighbor
GRIB
Some GRIB products store variables using a parameter code instead of an actual name. A GRIB TAB file with the extended metadata information is required to serve as an interpreter for the code. The text file—normally provided by the organization who produced the data—has a .TAB extension and contains the parameter code, name, center, subcenter, and the table version that produce the data. For example, NASA’s NLDAS dataset requires a GRIB TAB file to interpret variable code 153.
Create Multidimensional Dataset
Multidimensional Toolbox in ArcGIS Pro

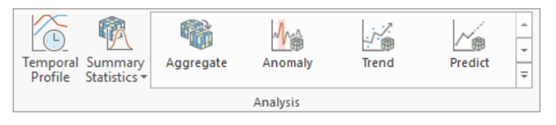
Analysis Tools (Examples to Follow) once access to ArcGIS Pro 2.5
Aggregate Multidimensional Raster(Spatial Analyst) (Image Analyst)- Generates a multidimensional raster dataset by aggregating existing multidimensional raster variables along a specific dimension. Choose an interval using a keyword, a value, or a range of values
This tool produces a multidimensional raster dataset in Cloud Raster Format (CRF).
Find Argument Statistics (Spatial Analyst) (Image Analyst)- Extracts a dimension or band index at which a given statistics for each pixel in a multidimensional or multiband raster.
Generate Multidimensional Anomaly (Spatial Analyst)(Image Analyst)- Computes the anomaly for each slice in a multidimensional raster to generate a multidimensional raster. An anomaly is the deviation of an observation from its standard or mean value
This tool produces a multidimensional raster dataset in Cloud Raster Format (CRF).
Generate Trend Raster (Spatial Analyst) (Image Analyst)- Estimates the trend for each slice in a multidimensional raster to generate a multidimensional raster.
Predict Using Trend Raster (Spatial Analyst) (Image Analyst)- Computes a forecasted multidimensional raster using the output trend raster from the Generate Raster Tool.
Build Multidimensional Info (2.5)- Generates multidimensional metadata in the mosaic dataset, including information regarding variables and dimensions. When you create a mosaic dataset from netCDF, GRIB, or HDF files, the multidimensional information is built into the mosaic dataset, and you can view the information in the dataset properties. The Build Multidimensional Info tool creates multidimensional information for a mosaic dataset that contains images collected at multiple times, depths, or heights, but was not created from netCDF files.
Build Multidimensional Transpose(2.5)- Transposes a multidimensional raster dataset, which divides the multidimensional data along each dimension to optimize performance when accessing pixel values across all slices. The input multidimensional raster must be in Cloud Raster Format (CRF).
Make Multidimensional Raster Layer(2.5)- Creates a raster layer from a multidimensional raster layer by slicing data along defined variables and dimensions. This tool creates a multidimensional raster layer from a multidimensional raster or mosaic dataset by extracting a subset of variables. For example, you have a mosaic dataset that contains 30 years of monthly precipitation data, and you only want to extract data for each January to see how precipitation has changed for that month
Make OPeNDAP Raster Layer- Creates a raster layer from data stored on an OPeNDAP server. The performance of this tool depends on the speed of the remote OPeNDAP server and the robustness of the Internet connection between the machine executing the tool and the remote server.
Select by Dimension- Updates a netCDF layer display or netCDF table view based on the dimension value. Inputs for this tool can be created using the Make NetCDF Feature Layer, Make NetCDF Raster Layer, Make Mosaic Layer, Make Image Server Layer or Make NetCDF Table View too
Subset Mutidimensional Raster(2.5)- Creates a subset of a multidimensional raster by slicing data along defined variables and dimensions. This tool produces a multidimensional raster dataset in Cloud Raster Format (CRF).
Creating a Cloud Raster Format (CRF) from a Mosaic Dataset
ArcGIS Multidimensional Cloud Raster Format is designed for multidimensional raster storage and analysis. The enhanced CRF format allows for optimized fast slicing operation and transposing for optimal profiling operation.
Users should use a Multidimensional mosaic dataset when you want to aggregate data from multiple files or publish a service with one or more processing templates. Users should convert to a Cloud Raster Format (CRF) to optimize temporal profile option for long time series datasets and for storage in the cloud.
- Select Analysis > Tools > Copy Raster
- Select a mosaic dataset in either local or remote database. (e.g., C:\Users\Administrator\Documents\aws_rds_geodb_conn.sde\sdt_db.sdt_user.cer_syn1deg_1hour_terra_aqua_modis)
- Select output file name (e.g., c:/tmp/crf/ceres.crf)
- In Properties tab, Check Process as Multidimensional.
- Check Build Multidimensional Transpose.
- In Environment tab, select LERC for compression.
- Change Width and Height to match raster x and y size. E.g., 360 and 180 for CERES.
- Upload CRF folder into an S3 bucket.
- Create S3 connection using Create Cloud Connection tool in Toolbox.
- Add it into folder in catalog pane.
- Browse the connection using catalog pane.
- Select CRF file that you uploaded. Share as web layer in portal as image service.
Analysis Tools (ArcGIS Pro 2.5)
Analysis Tool | Software | Licensing | Required Extension | Ouput |
Aggregate Multidimensional Raster | ArcPro 2.5 | Basic/Standard/Advanced | Image or Spatial Analyst | CRF |
Find Argument Statistics | ArcPro 2.5 | Basic/Standard/Advanced | Image Analyst | CRF |
Generate Multidimensional Anomaly | ArcPro 2.5 | Basic/Standard/Advanced | Image or Spatial Analyst | CRF |
Generate Trend Raster | ArcPro 2.5 | Basic/Standard/Advanced | Image Analyst | CRF |
Predict Using Trend Raster | ArcPro 2.5 | Basic/Standard/Advanced | Image Analyst | CRF |
Build Multidimensional Info | ArcPro 2.5 | Standard/Advanced | None | Mosaic |
Build Multidimensional Transpose | ArcPro 2.5 | Basic/Standard/Advanced | None | CRF |
Make Multidimensional Raster Layer | ArcPro 2.5 | Basic/Standard/Advanced | None | CRF |
Make OPeNDAP Raster Layer | ArcPro 2.5 | Basic/Standard/Advanced | None | Raster |
Select by Dimension | ArcPro 2.5 | Basic/Standard/Advanced | None | Raster |
Subset Multidimensional Raster | ArcPro 2.5 | Basic/Standard/Advanced | None | Raster |
Tutorial
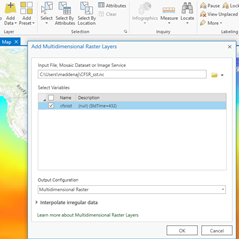
Adding Multidimensional Raster Layer
- Add Data , Add Multidimensional Raster Layer, Select netCDF file , select variables
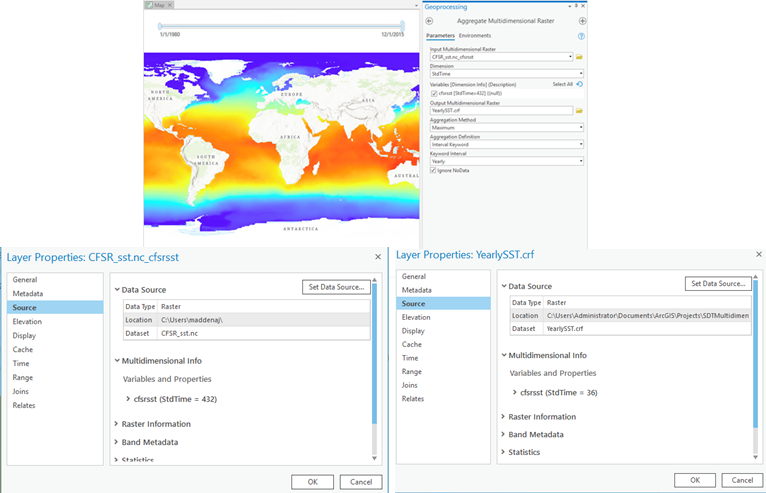
- Aggregate Multidimensional Raster - Generates a multidimensional raster dataset by aggregating existing multidimensional raster variables along a dimension.
Parameters:
Input Multidimensional Raster — cfsrsst
Variables — cfsrsst [StdTime=432] ((null)) checked on
Output Multidimensional Raster — YearlySST.crf
Dimension — StdTime (The aggregation dimension. This is the dimension along which the variables will be aggregated.)
Aggregation Method — Maximum, (Specifies the mathematical method that will be used to combine the aggregated slices in an interval.)
Aggregation Definition — Interval Keyword, (Specifies the dimension interval for which the data will be aggregated.)
Keyword Interval — Yearly, (Specifies the keyword interval that will be used when aggregating along the dimension. This parameter is required when the Aggregation Definition is set to Interval Keyword, and the aggregation must be across time.)
Ignore NoData — Checked on Ignore NoData (Specifies whether NoData values are ignored in the analysis.)
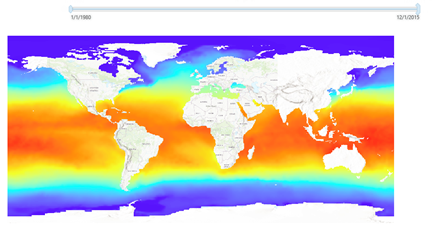
The result is a multidimensional raster dataset, in .crf format, containing the yearly maximum sea surface temperature value for every pixel and for every year in the data. Notice the multdimensional info SdTime is now 36 years vs the previous 432 months.
- Multidimensional Anomaly - Computes the anomaly for each slice in a multidimensional raster to generate a multidimensional raster. An anomaly is the deviation of an observation from its standard or mean value.
Parameters
Input Multidimensional Raster- The input multidimensional raster dataset.
Output Multidimensional Raster- The output Cloud Raster Format (CRF) multidimensional raster dataset.
Variables- The variable or variables for which anomalies will be calculated. If no variable is specified, all variables with a time dimension will be analyzed.
Anomaly Calculation Method- Specifies the method that will be used to calculate the anomaly.
Mean Calculation Interval- Specifies the temporal interval that will be used to calculate the mean.
Ignore NoData- Specifies whether NoData values are ignored in the analysis.
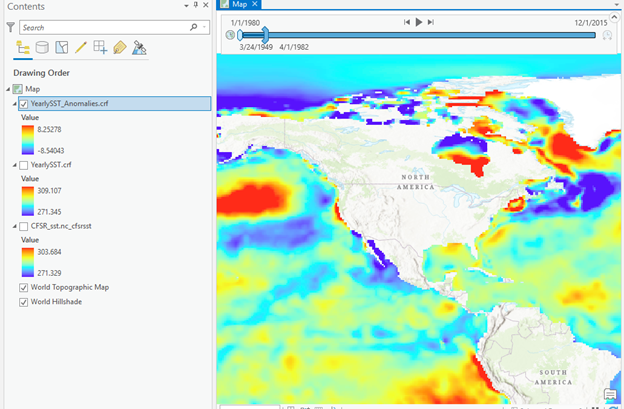
With the YearlySST_Anomalies.crf layer selected in the Contents pane, open the Appearance tab under the Raster Layer contextual tab on the ribbon. In the Rendering group, click the Stretch Type drop-down and select Standard Deviation.
The result is a multidimensional raster dataset, in .crf format, where pixels in red indicate maximum yearly temperatures that were higher than the global mean sea surface temperature in that year. Pixels in blue indicate temperatures lower than the global mean.

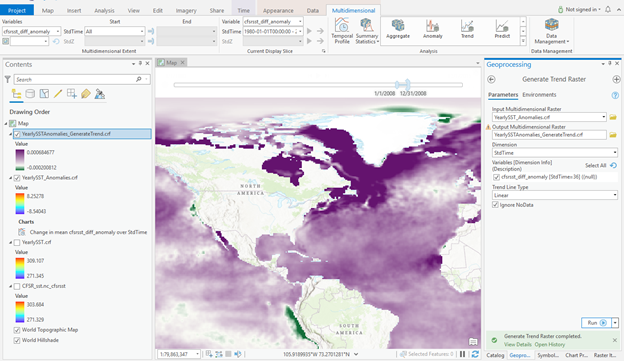
- Temporal Profile Change in Mean CFSRSST diff anomoly over time with Trendline

- Generate Trend Raster - Estimates the trend for each pixel along a dimension for one or more variables in a multidimensional raster. A use example for this tool is you have 40 years worth of monthly ocean temperature data, and you want to fit a trend line for each pixel to see where and how temperature changed over time.
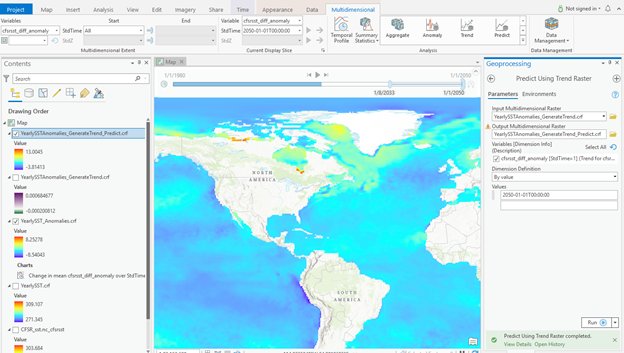
- Predict Using Trend Raster - Computes a forecasted multidimensional raster using the output trend raster from the Generate Trend Raster tool. This tool uses the output from the Generate Trend Raster tool as the input multidimensional trend raster.
Benefits and Lessons Learned
- Cloud Raster Format is optimized for writing and reading files and accesses large chunks of data from a large volume of raster data. CRF allows for storing multidimensional datacubes which contain multiple dimensions and many variables in a single efficient data structure.
- Local Raster Functions are supported with multidimensional raster data. For example, a user can combine temperature data CRF with your relative humidity CRF to create a multidimensional heat index layer by using the heat index raster function. There are over a 100 available raster functions available.
- Image Analyst is required to create the input CRF file via Generate Trend Raster. Prediction using Trend would be very beneficial to NASA sciences for predicting variables of interest at a specific location and future time.
- Tools need to be used in certain order for you to be able to get to the end result which may be learning curve for ordinary user. Use of ArcGIS Notebooks could streamline the workflows for users to run their analysis and focus on the outputs for their research.
- Both the ‘Build Multidimensional’ tool and ‘Build Multidimensional Transpose’ tool are easy to use for creating and accessing large scientific multidimensional datasets in a crf format and for slicing along specific dimensions resulting in optimized performance.
- Scripting for multidimensional raster analysis is now available through arcpy API.
- Map Algebra can be used with multidimensional data for calculating new outputs as derivatives of initial variable of interest.
- Temporal Profile feature allows for quick visualization of multidimensional data as various graphs and charts over time, at specific locations, and different variables of interest, which can be used for comparison and or investigating other variables that influence each other.
Pros | Cons |
Cloud Raster Format is optimized for writing and reading files and accesses large chunks of data from a large volume of raster data. CRF allows for storing multidimensional data cubes which contain multiple dimensions and many variables in a single efficient data structure. | Image Analyst is required to create the input CRF file via Generate Trend Raster. Prediction using Trend would be very beneficial to NASA sciences for predicting variables of interest at a specific location and future time. |
Local Raster Functions are supported with multidimensional raster data. For example, a user can combine temperature data CRF with your relative humidity CRF to create a multidimensional heat index layer by using the heat index raster function. There are over a 100 available raster functions available. | Tools need to be used in certain order for you to be able to get to the end result which may be learning curve for ordinary user. Use of ArcGIS Notebooks could streamline the workflows for users to run their analysis and focus on the outputs for their research. |
Both the ‘Build Multidimensional’ tool and ‘Build Multidimensional Transpose’ tool are easy to use for creating and accessing large scientific multidimensional datasets in a CRF format and for slicing along specific dimensions resulting in optimized performance. | Temporal Profile feature allows for quick visualization of multidimensional data as various graphs and charts over time, at specific locations, and different variables of interest, however limited on variety of different charts.
|
Scripting for multidimensional raster analysis is now available through arcpy API. |
|
Map Algebra can be used with multidimensional data for calculating new outputs as derivatives of initial variable of interest.
|
|
Multidimensional Workflows to Benefit POWER
- Temporal Profile Charting serves as a basic analysis tool for imagery data in a time series. Visualizing change over time with the temporal profile allows trends to be displayed and compared with variables, bands, or values from other dimensions simultaneously. Currently POWER can only do this for a single point location where as with ESRI Multidimensional Tool users can do temporal profiles for user defined geographic areas with more options on choosing location of interest for returning temporal profile. Using Multidimensional toolset users can also define temporal profile over a defined period of time versus just the average value per time period per slice.
- The Generate Multidimensional Anomaly can also benefit POWER by computing the anomaly or deviation from its standard or mean value for each slice in a multidimensional raster. Currently with POWER this can only be done using single point user selection.
Trend Analysis for time series imagery
Statistics of multidimensional raster
Subsetting multidimensional
Overview
Content Tools