Blog
search
attachments
weblink
advanced
Overview
Content Tools
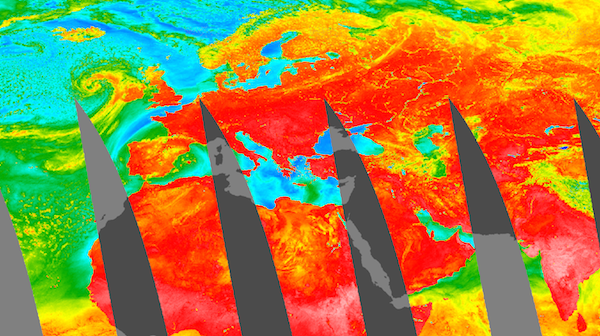
We are excited to announce the VIIRS Nighttime Imagery (Day/Night Band, Enhanced Near Constant Contrast) layer has been added to GIBS and Worldview!
This imagery shows the earth’s surface and atmosphere using a sensor designed to capture low-light emission sources, under varying illumination conditions. It is displayed as a grey-scale image. Sources of illumination include both natural and anthropogenic sources of light emissions. Lunar reflection can be used to highlight the location and features of clouds and other terrestrial features such as sea ice and snow cover when there is partial to full moon conditions. When there is no moonlight, natural and anthropogenic night time light emissions are highlighted such as city lights, lightning, auroras, fires, gas flares, and fishing fleets.
This layer is useful for showing patterns of human activity and energy behaviors such as cities and highways, the holiday periods, the tracking of shipping and fishing fleets at night and, the burning of waste natural gas (gas flares) from on and off shore oil/gas production sites.
Examples of the VIIRS Nighttime Imagery (Day/Night Band, Enhanced Near Constant Contrast)


This layer is updated daily, unlike the VIIRS Earth at Night 2012 image. The 2012 Earth at Night image was an image composite assembled from clear, cloud free images from 9 days in April 2012 and 13 days in October 2012.
The VIIRS Nighttime Imagery (Day/Night Band, Enhanced Near Constant Contrast) layer is available from the Visible Infrared Imaging Radiometer Suite (VIIRS) on the joint NASA/NOAA Suomi National Polar orbiting Partnership (Suomi-NPP) satellite. The sensor resolution is 750 m at nadir, imagery resolution is scaled to 500 m, temporal resolution is daily and temporal range for viewing in Worldview/Global Imagery Browse Services (GIBS) is 30 November 2016 - present.
Read more: Bringing Light to the Night: New VIIRS Nighttime Imagery Available through GIBS
References: Lee, T., S. Miller, F. Turk, C. Schueler, R. Julian, S. Deyo, P. Dills, and S. Wang, 2006: The NPOESS VIIRS Day/Night Visible Sensor. Bull. Amer. Meteor. Soc., 87, 191–199, doi: 10.1175/BAMS-87-2-191.; The Lights of London. NASA Earth Observatory; Out of the Blue and Into the Black. NASA Earth Observatory; Román, M. O. and Stokes, E. C. (2015), Holidays in lights: Tracking cultural patterns in demand for energy services. Earth's Future, 3: 182–205. doi:10.1002/2014EF000285
We have been very, very behind with our GIBS blog - we will make a concerted effort this year to ensure that this blog is kept up-to-date and you are wowed by all of our great new additions to GIBS! We also plan to announce any Worldview related updates here as well. Worldview is our web mapping client, powered by GIBS imagery.
We have A LOT of new imagery up in GIBS (and Worldview) since our last blog post, check it out below!
Visit GIBS Available Imagery Products for more information.
New and improved GIBS
In the Spring of 2016, the GIBS team deployed a new operational system (GIBS 1.0) with superior data storage, performance, and capabilities to the beta system it replaced. The release of GIBS 1.0 allowed for a doubling of its imagery products in 2016, both in number and storage. This has been accomplished along with a reduction in latency for NRT imagery and with a continuation of GIBS’ responsive request performance. The GIBS team continues to work closely with its user community to define and add new imagery products and features such as sub-daily (e.g., granules), vector-based, and vertical profile data visualizations.
The beta version of GIBS was initially released in 2011 enabling visual discovery and comparison of interdisciplinary science parameters by providing full resolution visual representations of NASA Earth science data in a free, open, and interoperable manner. Through responsive and highly available web services, GIBS now provides quick access to over 400 satellite imagery products, covering every part of the world. Many imagery products represent near real-time (NRT) data and are available within three hours after satellite overpass. Other imagery products span the entire science mission, up to 30 years of observation.
New Features in Worldview
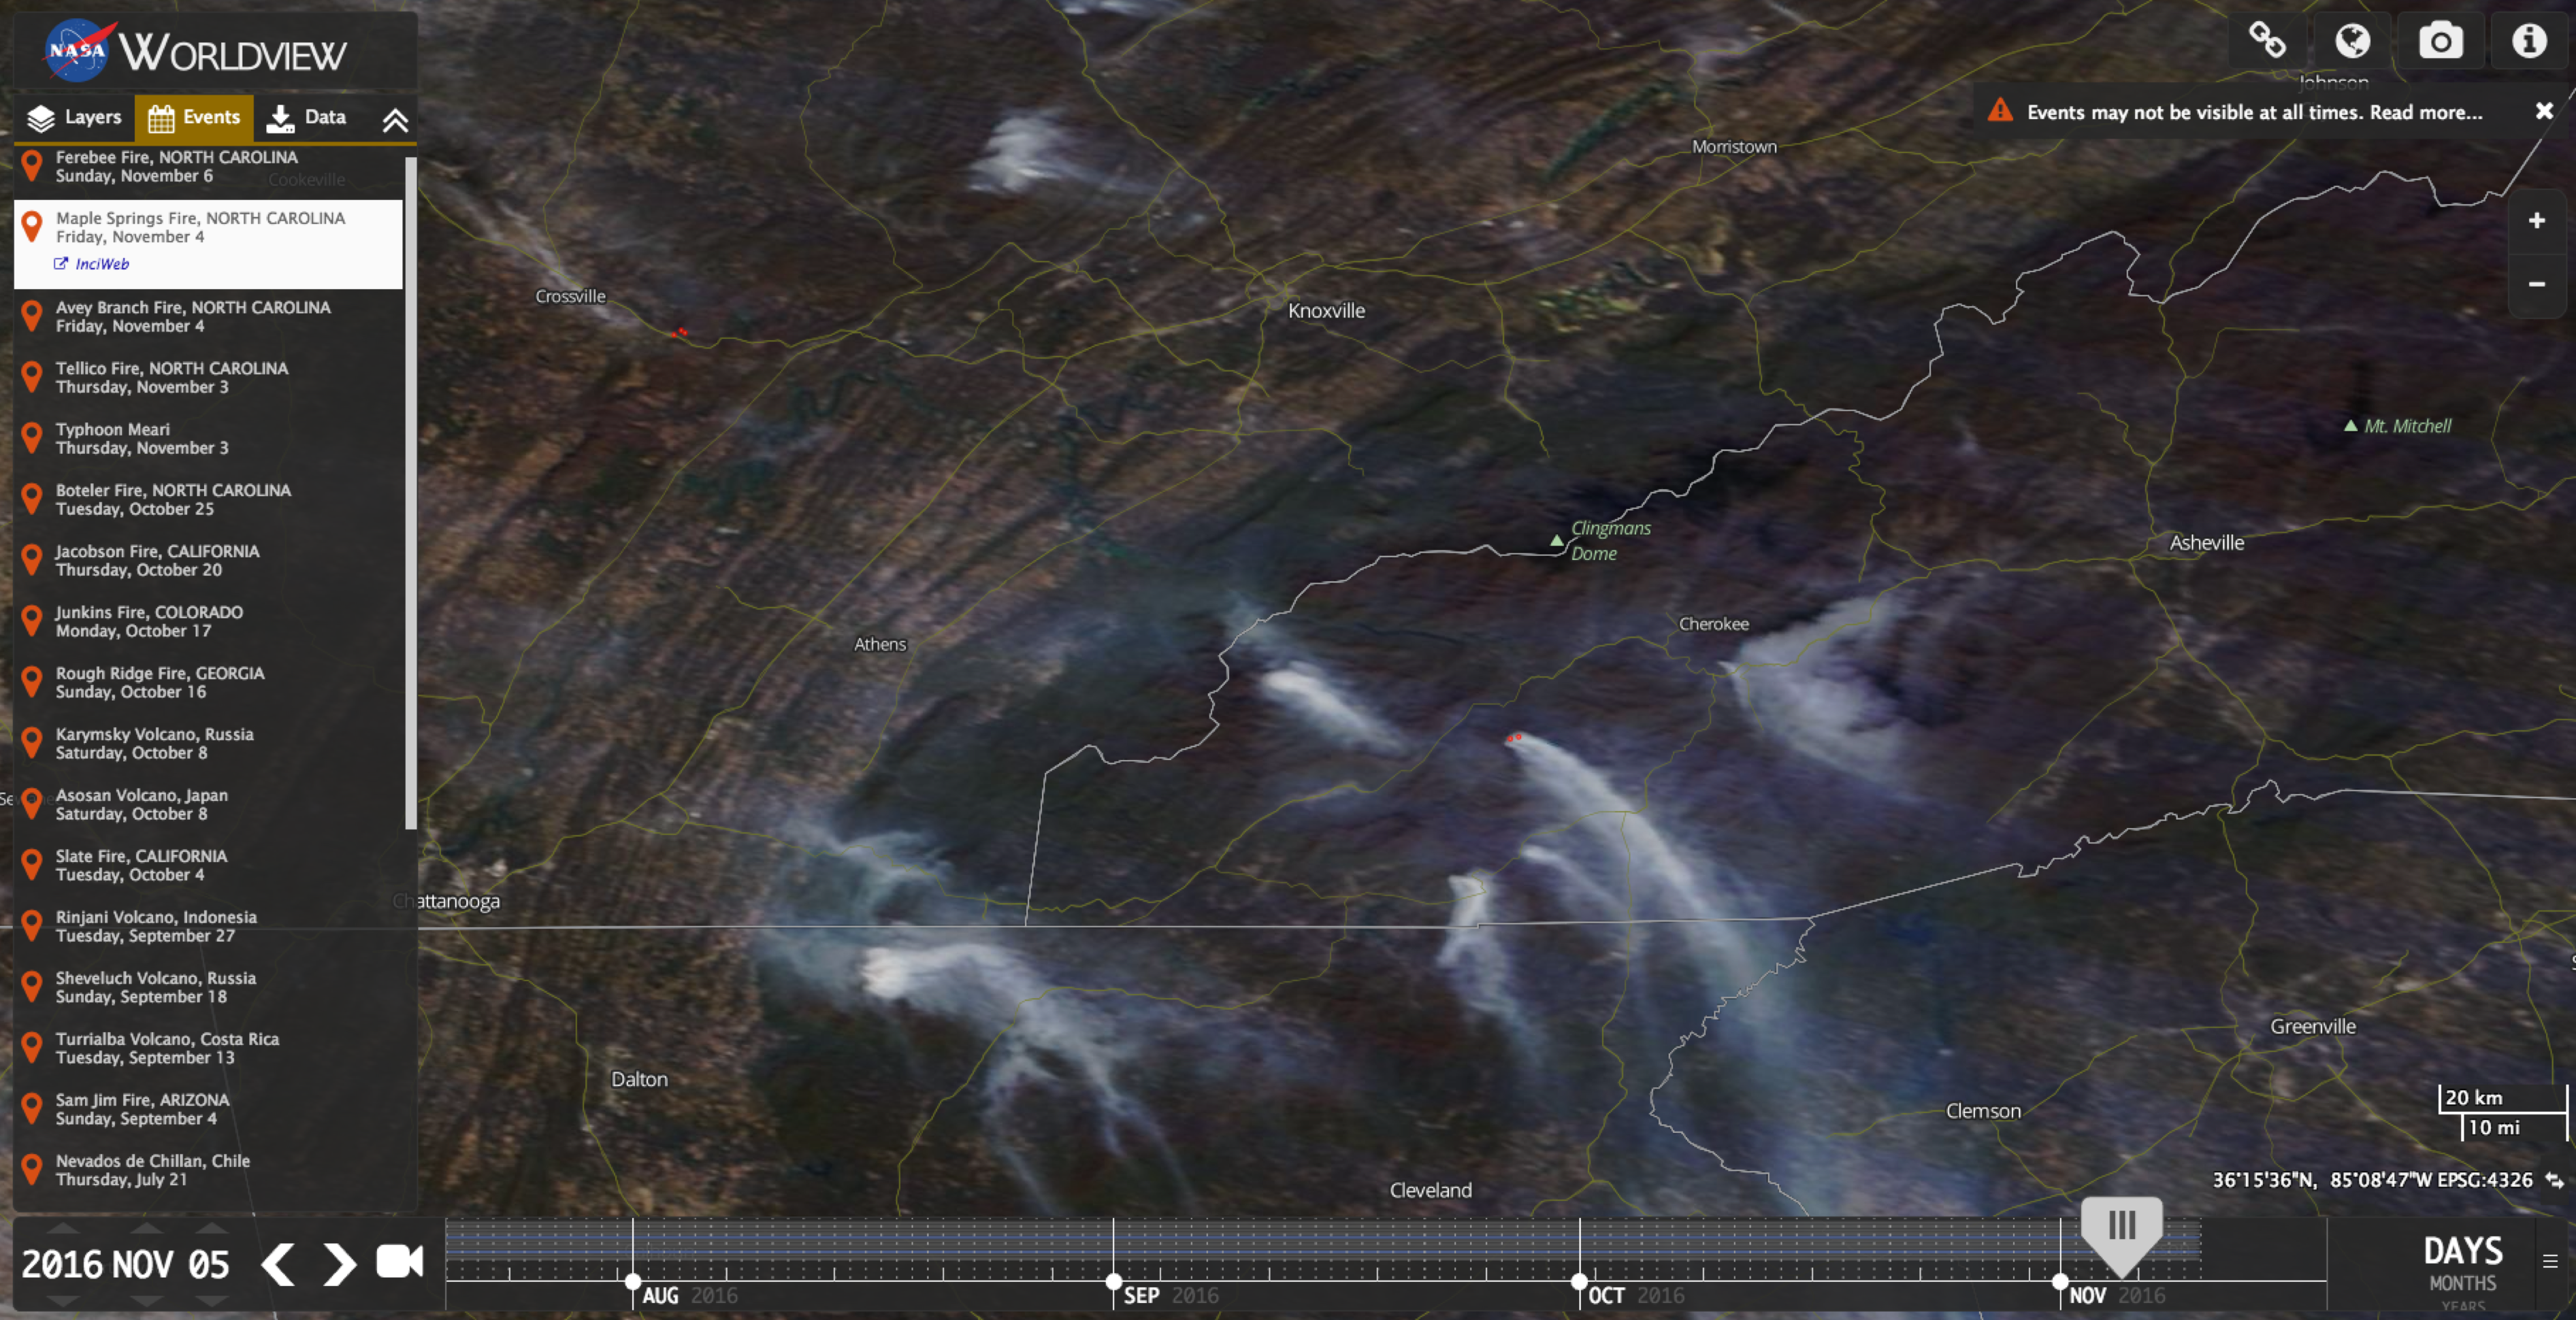
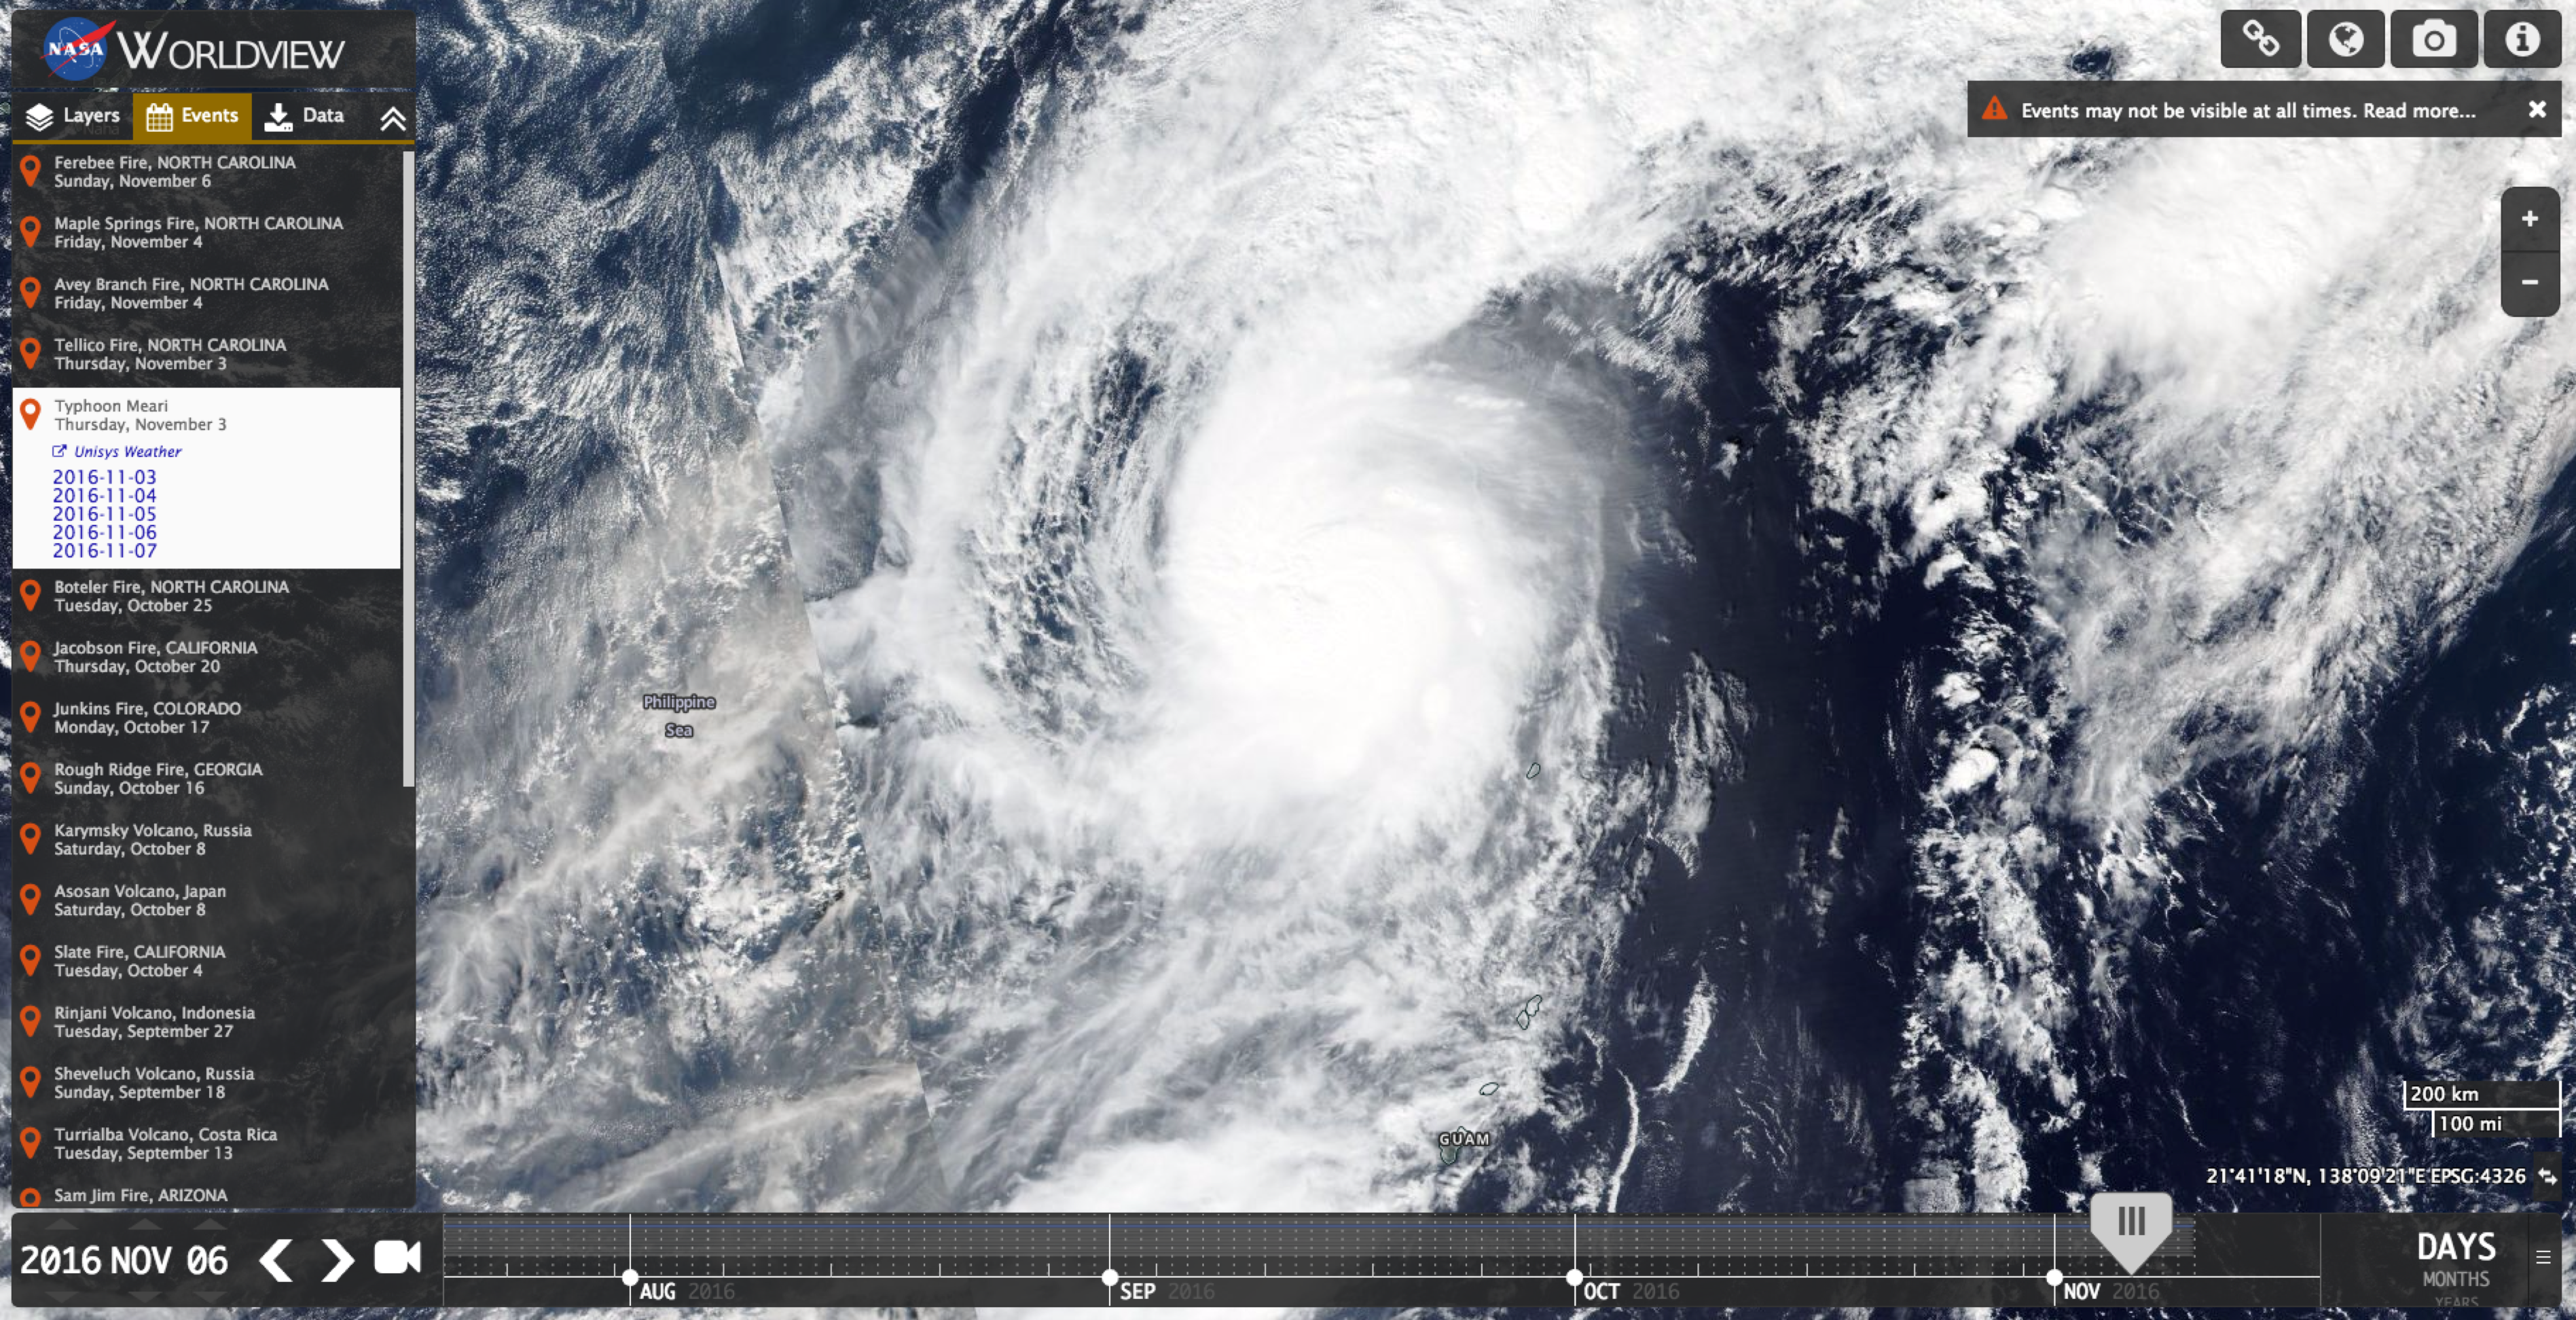
Natural Events Tab
This feature was added in collaboration with NASA Earth Observatory’s Natural Event Tracker (EONET). EONET provides a curated list of current natural events and hazards such as wildfires, severe storms and volcanic eruptions. Worldview uses this event list to provide users the ability to easily view pertinent GIBS imagery layers for the date(s) and geographical area of a selected event.
Animation
The new animation feature allows users to create, download, and share animations that more easily demonstrate the dynamic processes shown in the imagery.
Push the play button at the bottom/center of the screen here to watch the Yosemite Rim Fire grow in size and change the underlying landscape:
Here’s an example showing the calving of iceberg B-31 from Antarctica’s Pine Island Glacier:

Polar Rotation
Users are now able to rotate the imagery in the Arctic and Antarctic views. The user now has the power to decide what direction is "up".
Coming soon...
Keep your eyes peeled for new features and improvements in Worldview!
Update on 2016 April 13: generation of Terra / MODIS atmospheric products has now restarted as of 2016 April 8. Likewise, atmospheric imagery from that date forward is now available in GIBS. See here for full details:
https://ladsweb.nascom.nasa.gov/news/?id=1370
Original post from 2016 March 3:
The Terra spacecraft along with its MODIS instrument entered safe mode on 2016 February 18 during an inclination adjustment maneuver (IAM). It recovered from safe mode into normal mode on February 22 and reentered into science operations on February 24. Data will therefore be missing between February 18-24.
Though the data is currently being acquired and processed, the resulting data products are degraded and are not expected to meet science quality due to instrument temperatures not yet reaching their normal operating value. Most atmosphere products and some land products are disabled. As of 2016 February 4 000z, land products will resume processing and atmosphere products will resume at a future date.
GIBS imagery products are dependent on these data products and will be produced accordingly.
Please contact support@earthdata.nasa.gov if you have further questions.
 |  |  |  |
 |  |  |  |
 |  |  |  |
 |  |  |  |
From soil moisture and temperature to snow mass to heterotrophic respiration, 16 new Soil Moisture Active Passive (SMAP) layers are now available in GIBS!
See here for all of the layers pre-populated in Worldview with the exception of Freeze/Thaw, which you can view in Arctic Polar Stereographic mode.
The full list of new products is:
- Soil Moisture (L3, Active)
- Soil Moisture (L3, Active/Passive)
- Surface Soil Moisture (L4, 12z Instantaneous)
- Surface Soil Moisture Uncertainty (L4, 12z Instantaneous)
- Surface Soil Temperature (L4, 12z Instantaneous)
- Snow Mass (L4, 12z-3z Average)
- Gross Primary Production (L4, 9 km Grid Cell Mean)
- Root Zone Soil Moisture (L4, 12z Instantaneous)
- Root Zone Soil Moisture Uncertainty (L4, 12z Instantaneous)
- Net Ecosystem CO2 Exchange (L4, 9 km Grid Cell Mean)
- Heterotrophic Respiration (L4, 9 km Grid Cell Mean)
- Percent of Potential Vegetation Light Use Efficiency (L4, 9 km Grid Cell Mean)
- Percent Frozen Area (L4, 9 km Grid Cell Coverage)
- Disaggregated Brightness Temperature (L3, Active/Passive, H Polarization)
- Disaggregated Brightness Temperature (L3, Active/Passive, V Polarization)
- Freeze/Thaw (L3, Active, Arctic Polar Stereographic)
The "Active" and "Active/Passive" products are available from April 15, 2015 through July 7, 2015. The "L4" products are available from March 31, 2015 through the present and will be available on an ongoing basis.
When we originally open sourced GIBS' tiled imagery storage format and server two years ago, we hoped that it would encourage usage and contributions from those outside of our project. Originally developed at NASA's Jet Propulsion Laboratory, the Meta Raster Format (MRF) is a key piece of what allows GIBS to efficiently serve over 200 trillion pixels (and counting!) to thousands of users per day without breaking a sweat. Today we're happy to report that Esri has contributed a data compression algorithm to the MRF repository called Limited Error Raster Compression (LERC).
LERC is designed to efficiently serve mapping data (as opposed to imagery) such as elevation or temperature values which can then be rapidly retrieved online. A primary feature of LERC is the ability to tune the size of the data based on the application's needs and the characteristics of the data itself. It accomplishes this by allowing the data provider to precisely control the amount of error allowed between the original data values and the compressed data values. This could range somewhere from lossless (i.e., no difference between original and compressed data) and lossy (e.g., 0.1 degree Celsius tolerance for a temperature dataset).
This compression and decompression is also designed to be fast enough to perform in the browser. A JavaScript decoder is currently available in the LERC repository.
Esri has contributed this patented code to the MRF repository under an Apache v2.0 open source license for "GIS, terrestrial and extra-terrestrial mapping, and other related earth sciences applications."
While GIBS does not currently serve data using LERC, NASA's Earth Science Data and Information System (ESDIS) plans to investigate how GIBS-like access to data could better support its mission. Besides accessing through standard tile-based retrievals, we imagine it might also gain traction by supporting the use of scripts to rapidly scrape only the data of interest.
We hope that you'll also find some good uses! Please let us know at support@earthdata.nasa.gov if you do or have questions.

We are pleased to announce the availability of two new sea surface temperature layers provided by the Group for High Resolution Sea Surface Temperature (GHRSST):
- Multi-scale Ultra-high Resolution (MUR) Sea Surface Temperature (SST) available on a daily basis from June 1, 2002 through the present
- Global 1-km Sea Surface Temperature (G1SST) available on a daily basis from June 9, 2010 through the present

While we love everything that MODIS has done and is still doing after 15+ years (!), we're very excited about the next generation of moderate resolution imagery provided by VIIRS - the Visible Infrared Imaging Radiometer Suite - on the Suomi-NPP satellite! GIBS is now providing daily, global mosaics of VIIRS imagery in full resolution. These include
- Corrected Reflectance (True Color)
- Corrected Reflectance (Bands M3-I3-M11)
- Corrected Reflectance (Bands M11-I2-I1)
- Fires and Thermal Anomalies (Day, 375m)
- Fires and Thermal Anomalies (Night, 375m)
Check them out in Worldview! For this initial release, imagery begins on November 24, 2015 and is being produced in an ongoing basis in near real time - the imagery is available within 3-5 hours of acquisition from the satellite with the goal of reducing that latency further.
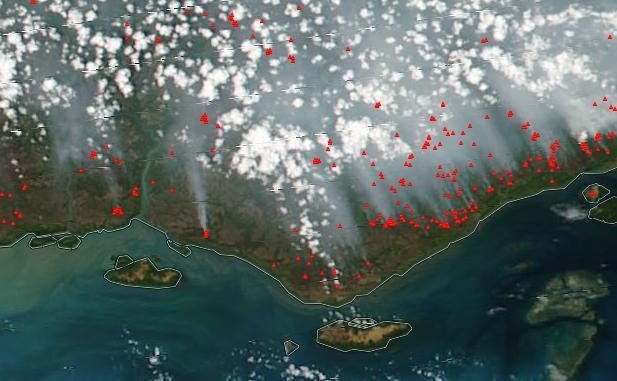
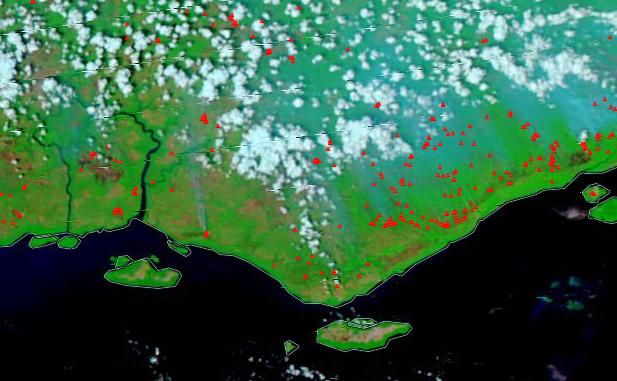
VIIRS fires are represented as tiny triangles whereas tiny dots are used for MODIS fires. The first image above shows VIIRS fires + corrected reflectance with true color bands; the second, VIIRS fires + corrected reflectance with M11-I2-I1 bands to show burned areas (reddish brown) and through the smoke.

One of the most visually striking differences between VIIRS and MODIS is that VIIRS has a wider swath which provides full coverage of the globe on a daily basis. Here is a toggle between Aqua/MODIS and Suomi-NPP/VIIRS from December 7, 2015. That wider swath does have a tradeoff, though - the maximum spatial resolution of VIIRS is 375 meters per pixel while MODIS is 250 meters per pixel.


Corrected Reflectance layers are also available in north and south polar stereographic projections. Don't mind the giant area of darkness at the north pole during this time of year! Due to the lack of winter sunlight during satellite overpasses, daytime imagery cannot be collected near the pole.
All layers are now available in Worldview, your GDAL-based scripts, your map clients, etc. We hope you enjoy them as much as we do! Feel free to contact us at support@earthdata.nasa.gov with questions or comments.

We’re pleased to announce the release of OnEarth-Boxes (https://github.com/nasa-gibs/onearth-boxes), a new system that makes it easy to create new virtual machines with pre-configured OnEarth servers for experimentation, education, and development. OnEarth is the lightweight geospatial imagery server used by GIBS to serve hundreds of products to users across multiple map projections.
Using Packer (http://packer.io) virtual machine image creation software, OnEarth-Boxes creates a ready-to-go CentOS6 VM with OnEarth, the MRF imagery storage format, and their dependencies installed and configured. Build scripts are currently included to make VMWare, VirtualBox, and Vagrant/VirtualBox images.
OnEarth-Boxes also includes some demo imagery, accessible through a simple OpenLayers endpoint. WMTS, TWMS/KML, and Mapserver endpoints are pre-configured. Use OnEarth-Boxes to get a feel for how the software works and what its capabilities are without having to integrate it within an existing system.
Since all the OnEarth/MRF utilities are included, OnEarth-Boxes is a great way to quickly get an instance of OnEarth running in order to experiment with your own imagery. Especially when using Vagrant, it’s easy to import new imagery into the VM via a shared folder, create MRFs, and add new layers to OnEarth.
OnEarth-Boxes is also useful as a sandbox for development with OnEarth or MRF. All the source code is included and linked to the Github repo by default, and all the necessary development utilities for compilation and RPM-building are installed.
The Packer build process is highly customizable and allows for easy, repeatable creation of OnEarth VMs by modifying the build parameters and scripts. The Packer infrastructure includes multiple builders and post-processors for a wide variety of VM environments.
To get started with OnEarth-Boxes, visit https://github.com/nasa-gibs/onearth-boxes.

We're pleased to announce the availability of new Global Digital Elevation Models in GIBS from Terra's Advanced Spaceborne Thermal Emission and Reflection Radiometer (ASTER) instrument and the Shuttle Radar Topography Mission (SRTM). These products are available globally at their full resolution of 30 meters per pixel.
The ASTER products were created from approximately 1.5 million scenes (ASTER stereo pair observations) dating back to 2000 and covers land surfaces between 83°N and 83°S. The SRTM product is based on Space Shuttle Endeavour's STS-99 mission in February 2000 using two radar antennas.
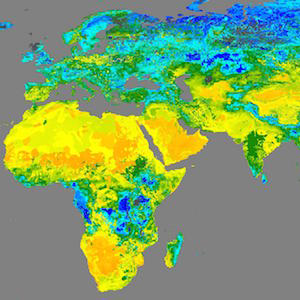
Shown above is the ASTER GDEM Color Shaded Relief layer. It shows surface elevation as shaded relief in color. Features such as mountains, valleys, plateaus and canyons with steep slopes will appear more rough, while flat areas will appear more smooth. Areas of lower elevation appear darker green, and areas of higher elevation are reds to white. Areas below sea level are a flat grey.

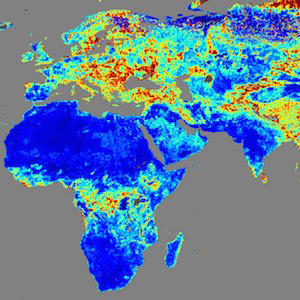
The ASTER GDEM Greyscale Shaded Relief layer (above) shows surface elevation as shaded relief in shades of grey.

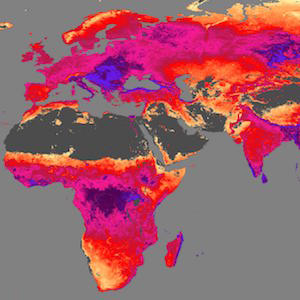
The SRTM Color Index (above) and ASTER GDEM Color Index layers show land elevation around the world, measured in meters. On the default palette, white indicates the highest elevations, then brown, yellow and greens indicate low elevations.
We hope that you'll find good ways to use these with or without your other favorite NASA science data products.
NASA’s Global Imagery Browse Services (GIBS) is your source for visualized radiometer data products from NASA’s Soil Moisture Active Passive (SMAP) mission. Four Level 1 global radiometer products recently have been added to the list of Worldview active layers and can be overlain on the Worldview base image with the click of a button:
- Uncorrected Brightness Temperature
- Uncorrected Brightness Temperature Radio Frequency Interference (RFI)
- Uncorrected Brightness Temperature Quality Assurance (QA)
- Faraday Rotation Angle
All of these products are available in fore and aft views. Uncorrected Brightness Temperature products also are available in H and V polarization. Imagery for these products is available back to July 30, 2015, and is being forward processed. Earlier dates will be added when generated by SMAP’s Science Data System (Figure 1).

Figure 1: The underlying SMAP image data can be downloaded from NASA's National Snow and Ice Data Center (NSIDC) Distributed Active Archive Center (DAAC) by clicking the Worldview "Download Data" button.
Image courtesy of NASA Worldview.
SMAP launched on January 31, 2015, on a three-year mission to provide global soil moisture and freeze/thaw data. The satellite carries two instruments—an active radar and a passive radiometer. SMAP radiometer data have been processed to map microwave emissions from Earth’s surface, which are expressed as brightness temperatures in degrees Kelvin. SMAP’s radar began regular operations on April 13, but stopped transmitting on July 7 due to an anomaly that is still being investigated by the SMAP team at NASA’s JPL.
Getting near real-time data over the oceans just became easier thanks to the addition of 10 new products to NASA’s Global Imagery Browse Services (GIBS). The new products include:
- Columnar Cloud Liquid Water (day/night )
- Columnar Water Vapor (day/night)
- Wind Speed (day/night)
- Surface Precipitation Rate (day/night)
- Surface Rain Rate (day/night)
These products generally will be available within three to four hours of a satellite overpass, and are available for viewing through NASA’s Worldview or similar GIBS client systems.
Wind Speed (Day) is one of 10 new AMSR2 near real-time products available through GIBS. Image courtesy of Worldview.
The products are from data collected by the Advanced Microwave Scanning Radiometer 2 (AMSR2) instrument on the Japan Aerospace Exploration Agency (JAXA) Global Change Observing Mission for Water (GCOM-W1) satellite, and are produced by NASA’s Land, Atmosphere Near real-time Capability for EOS (LANCE) AMSR2 Processing Center at NASA’s Global Hydrology Resource Center Distributed Active Archive Center (GHRC DAAC).
While LANCE near real-time products are not intended to take the place of data products with the detailed processing necessary for scientific research, they are an invaluable resource for users needing rapid, continually updated views of ongoing Earth processes.
We are pleased to announce that two new sets of imagery products are now available in GIBS in the Geographic, North Polar Stereographic, South Polar Stereographic, and Web Mercator projections:
- Aqua / AMSR-E (Advanced Microwave Scanning Radiometer-EOS) Sea Ice consisting of
- Blue Marble: Next Generation consisting of
More details regarding these products are found below:
Aqua / AMSR-E Cryosphere Products

AMSR-E Sea Ice Concentration (12km)
The Advanced Microwave Scanning Radiometer-EOS (AMSR-E) instrument on the NASA Earth Observing System (EOS) Aqua satellite provides global passive microwave measurements of terrestrial, oceanic, and atmospheric variables for the investigation of global water and energy cycles. The Level-3 gridded products (AE_SI6, AE_SI12, AE_SI25) includes brightness temperatures collectively ranging from 6.9 through 89.0 GHz , sea ice concentration, and snow depth over sea ice. Sea ice concentration and brightness temperatures include daily ascending averages, daily descending averages, and daily averages; snow depth over sea ice data is a five-day running average. The GIBS and AMSR team have selected the primary science parameters contained within each gridded product and each spatial resolution for increased visualization usage. Note that the recent reprocessing of the AMSR-E version 3 algorithm includes an improved Antarctic land mask with an updated ice shelf definition, created by the National Ice Center Science Department in June 2011, as well as an updated shoreline developed from ENVISAT and RADARSAT imagery from October 2009 to April 2010.
More information about the AMSR-E Level-3 gridded products is found here. More information about the version 3 reprocessing is found here.
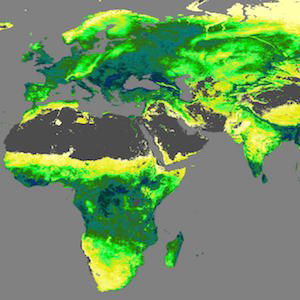
Blue Marble: Next Generation

Blue Marble: Next Generation w/ Topography and Bathymetry (August 2004)
The Blue Marble: Next Generation is a series of images that show the color of the Earth’s surface for each month of 2004 at moderate resolution (500 meters/pixel) at a global scale. These monthly images reveal seasonal changes to the land surface: the green-up and dying-back of vegetation in temperate regions such as North America and Europe, dry and wet seasons in the tropics, and advancing and retreating Northern Hemisphere snow cover. In 2004, the generation of the Blue Marble: Next Generation imagery utilized new techniques allowing the computer to automatically recognize and remove cloud-contaminated or otherwise bad data—a process that was previously done manually. The quality of the Blue Marble imagery was notable for its time. So much so that Steve Jobs and team selected it for the default wallpaper for the Apple iPhone.
GIBS has selected the August monthly imagery for the three static layers available for use. August was selected based on the lower concentration of snow that exposes more land features. The Blue Marble: Next Generation imagery includes the a base image along with bathymetry and topography visual enhancements. These enhancements are described below:
Bathymetry
Bathymetry is a digital image of the undersea land surface and water depth. Bathymetry is the underwater equivalent of land topography. In the maps provided here, shading indicates changes in slope or depth. Much of the data on ocean bathymetry come from "soundings." To collect a sounding, scientists use sonar devices to emit a sound wave that passes into the water. By measuring how long it takes the sound wave to bounce off the ocean floor and return to the sonar, scientists can estimate the depth of the water. Other characteristics of the returned sound wave can help reveal the shape and size of features on the sea floor. These images represent ocean depths between -8000m and 0m (surface).
Topography
Land topography is a digital image of the three-dimensional structure of the Earth's surface. Shading indicates changes in slope or elevation. The relief shading in this topographic map comes mostly from elevation data collected by space-based radars. Topography not only gives a realistic picture of what the Earth's surface actually looks like, it also helps scientists determine things like how rivers and streams drain through the landscape, where lowlands are prone to flooding, how plate tectonics or erosion are building or wearing away mountains, where hills may be prone to landslides, or how a volcanic eruption changed the shape of a mountain. Topography is also one of the factors that influences where particular ecosystems exist. Therefore topography is one of the factors that scientists can use to predict where certain plants or animals, such as endangered species, might be found.
More information about the Blue Marble: Next Generation imagery products can be found here.
As a long overdue announcement, source code to the EOSDIS Worldview satellite imagery browsing tool is available on GitHub as of April 22, 2014.
↓

https://github.com/nasa-gibs/worldview
Worldview was originally created to be a reference client to "keep the Global Imagery Browse Services (GIBS) honest" by ensuring its services are usable for client developers. From a user perspective, it provides a mechanism to visually discover "interesting" phenomena within EOSDIS imagery, download that imagery, and also download the underlying data granules which generated the imagery.
We hope that the release of this source code will encourage other client developers to reuse and build upon this work for their own needs. Or if something simpler is needed to start with, there are always the barebones GIBS Web Examples for integrating GIBS imagery with Leaflet, OpenLayers, Google Maps, and Bing Maps.
For questions or comments, please contact us at support@earthdata.nasa.gov.
MODIS Aerosol Optical Depth mashed with Google Maps
The GIBS team is pleased to announce the availability of imagery in the Web Mercator / Google Maps / EPSG:3857 / EPSG:900913 map projection in addition to the already-supported Geographic (EPSG:4326), Arctic Polar Stereographic (EPSG:3413), and Antarctic Polar Stereographic (EPSG:3031) projections. This now enables integration of GIBS imagery with widely-used maps such as Google Maps, Bing Maps, and OpenStreetMap up to zoom level 9.
We've updated our API documentation, GIBS Web Examples on GitHub, and live demos such as Leaflet, Google Maps, and Bing Maps. We look forward to seeing what you build!
Please note that currently the "leading edge" of new Web Mercator imagery is available 2-4 hours after the Geographic imagery is produced for a total latency of 5-9 hours from the time the satellites capture the imagery until it is available in GIBS. Please also note that zoom level 0 (the top tile) is not currently supported.
Questions or comments? Write us at support@earthdata.nasa.gov.
We are pleased to announce that two new sets of imagery products are now available in GIBS:
- Aqua / AMSR-E (Advanced Microwave Scanning Radiometer-EOS) Brightness Temperature consisting of
- MEaSUREs (Making Earth System Data Records for Use in Research Environments) Global Record of Daily Landscape Freeze/Thaw consisting of
These products mark two milestones for the GIBS project:
- Imagery has been visualized and is available for every day throughout the entire MEaSUREs Freeze/Thaw and AMSR-E Brightness Temperature mission. Most of the other products in GIBS do not yet contain imagery from the entire mission duration.
- The Freeze/Thaw product is the first of many MEaSUREs datasets to be visualized and made available through GIBS.
More details regarding these products are found below:
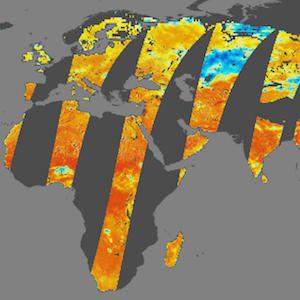
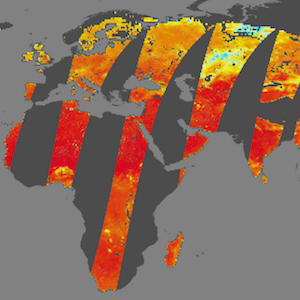
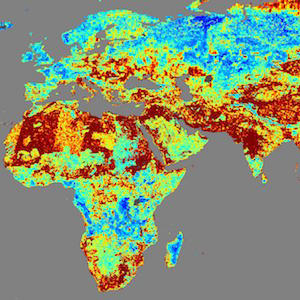
Aqua / AMSR-E Brightness Temperature
AMSR-E Brightness Temperature (89H GHz B Scan, Day), 2003-05-07
The (AMSR-E) instrument on the NASA Earth Observing System (EOS) Aqua satellite provides global passive microwave measurements of terrestrial, oceanic, and atmospheric variables for the investigation of global water and energy cycles. The AMSR-E Level-2A product (AE_L2A) contains horizontally and vertically polarized brightness temperature measurements at 6.9 GHz, 10.7 GHz, 18.7 GHz, 23.8 GHz, 36.5 GHz, and 89.0 GHz. The GIBS and AMSR-E team have selected the 89.0 GHz horizontal and vertical parameters for visualization. These measurements provide the highest level of data resolution from the available scan channels. More information can be found here.
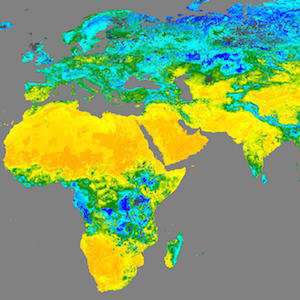
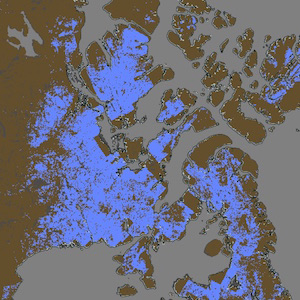
MEaSUREs Freeze/Thaw

Key: Blue = Frozen. Red = Thawed, Olive = Transitional, Bright Green = Inverse Transitional
MEaSUREs Daily Landscape Freeze/Thaw, SSM/I-SSMR, 2004-02-24
MEaSUREs (Making Earth System Data Records for Use in Research Environments) products are generally created by linking together multiple satellites into a constellation, creating a longer-running, consistent data record. The MEaSUREs Freeze/Thaw product is a Global Record of Daily Landscape Freeze/Thaw created from a Scanning Multichannel Microwave Radiometer (SMMR) and Special Sensor Microwave/Imager (SSM/I) record for the years 1979 to 2010; and an Advanced Microwave Scanning Radiometer - Earth Observing System (AMSR-E) record for the years 2002 to 2011. The goal of the product is to quantify global vegetated land surface freeze/thaw state dynamics over a long-term data record of more than 25 years. More information can be found here and here.