Page History
...
Metadata providers have a choice about which metadata dialect(s) they use to submit metadata to the CMR. We compared the SciOps and NASA collections to understand how does this choice effects the metadata content.
Data Selection
The SciOps data collection includes over 13,000 metadata records from nearly 2,000 different sources, most outside of NASA. Over 1700 of these sources have less than ten metadata records. Assuming that there is variation in metadata creation techniques for these providers, this is likely not a homogeneous collection. We identified 25 providers that have collections with one hundred or more records and examined those as separate collections.
...
Bubble Chart Interpretation
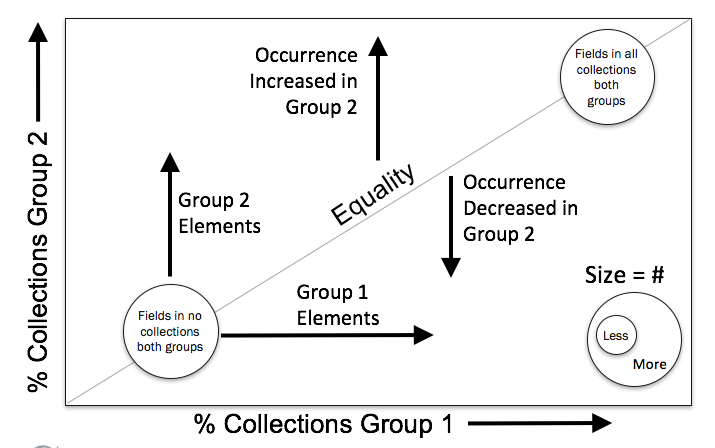
NASA
...
Complete vs SciOps
...
Complete
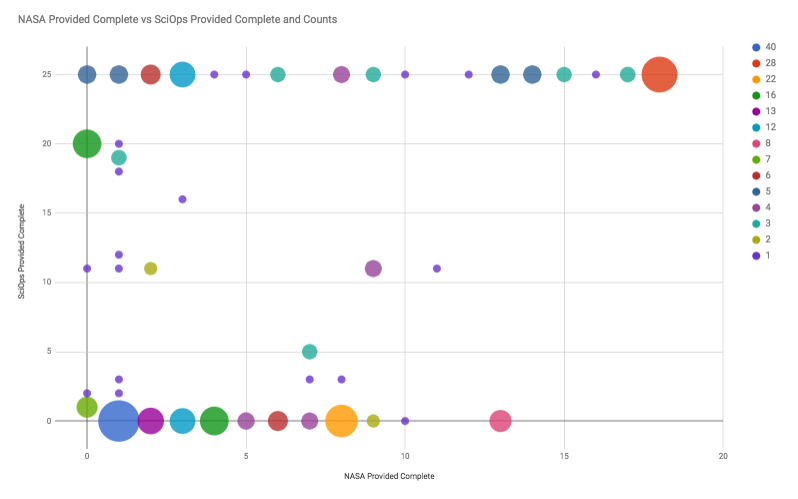
Chart 1 below compares item existence (elements and attributes) completeness in NASA Collections with SciOps collections. The X axis shows the number of NASA collections that include are complete with respect to an item. The Y axis shows number of SciOps collections that include an itemof SciOps collections that are complete with respect to an metadata items. The bubble size shows the number of items included in the 2 collections.
The large red bubble in the upper right corner of the plot shows the items (elements and attributes) that exist that are complete is all 18 NASA collections and in all 25 SciOps 25 SciOps collections. This bubble includes 43 28 items, as shown in the legend. The large blue bubble in the lower left corner of the plot shows the items that exist is are complete in 1 NASA collection and in 0 SciOps 0 SciOps collections. This bubble includes 44 40 items, as shown in the legend. The data for Chart 1 is accessible in Google Sheets. To view the data and bubble chart in Google Sheets click on the image.
Chart 1: NASA EXIST Complete vs SciOps ExistsComplete

Accessing the Chart
To access the data for this chart, click on the chart graphic above to view an interactive version in Google Sheets. The interactive version enables data identification for each bubble and includes a look up table for identifying the ISO items (elements and attributes) associated with the bubble. To access and use the interactive version:
- Click on the chart graphic above to view the chart in Google Sheets
- Hover over the bubbles with your mouse to identify item existence in the number of complete NASA collections and item existence in SciOps the number of complete SciOps collections associated with the bubble. The hover identification also shows the number of items (Counts) associated with each bubble.
- To the right of the chart is a lookup table for identifying the xpaths associated with each of the bubbles. To identify the xpaths associated with a bubble, match the NASA Exists and SciOps Exists value pairs Provided Complete and SciOps Provided Complete values (from the bubble hover) with the value pairs values in the look up table.
NASA
...
Exist vs SciOps
...
Exist
Chart 2 below compares item (elements and attributes) completeness existence in NASA Collections with SciOps collections. The X axis shows the number of NASA collections that are complete with respect to include an item. The Y axis shows number of SciOps collections that are complete with respect to an metadata itemsof SciOps collections that include an item. The bubble size shows the number of items included in the 2 collections.
The large red bubble in the upper right corner of the plot shows the items that are complete (elements and attributes) that exist is all 18 NASA collections and in all 25 SciOps 25 SciOps collections. This bubble includes 28 43 items, as shown in the legend. The large blue bubble in the lower left corner of the plot shows the items that are complete in exist is 1 NASA collection and in 0 SciOps 0 SciOps collections. This bubble includes 40 44 items, as shown in the legend. The data for Chart 2 is accessible in Google Sheets. To view the data and bubble chart in Google Sheets click on the image.
Chart 2: NASA Complete EXIST vs SciOps CompleteExists
Accessing the Chart
To access the data for this chart, click on the chart graphic above to view an interactive version in Google Sheets. The interactive version enables data identification for each bubble and includes a look up table for identifying the ISO items (elements and attributes) associated with the bubble. To access and use the interactive version:
- Click on the chart graphic above to view the chart in Google Sheets
- Hover over the bubbles with your mouse to identify the number of complete item existence in NASA collections and the number of complete SciOps item existence in SciOps collections associated with the bubble. The hover identification also shows the number of items (Counts) associated with each bubble.
- To the right of the chart is a lookup table for identifying the xpaths associated with each of the bubbles. To identify the xpaths associated with a bubble, match the NASA Provided Complete and SciOps Provided Complete values Exists and SciOps Exists value pairs (from the bubble hover) with the values value pairs in the look up table.
Elements in all NASA and Other Collections
...
Overview
Content Tools