Page History
| Table of Contents |
|---|
The CMR includes metadata that originate in three dialects: DIF, ECHO, and ISO. The largest portion of CMR collection records are in the SciOps collection, and originate in DIF format. These are referred to here as the SciOps group. The second largest portion of metadata for NASA collections come from the NASA DAACs and originate in ECHO format. These are referred to here as the NASA group. A third group of metadata in the CMR originate from agencies around the world that participate in the International Directory Network. These records originate in DIF and are referred to as the IDN group.
The DIF and ECHO dialects were originally developed to facilitate discovery of collections in the Global Change Master Directory or ECHO. The content of these “discovery” dialects is translated into the ISO dialects that are the eventual target for CMR. This translation is generally done without augmentation, so the content does not change very much.
Metadata providers have a choice about which metadata dialect(s) they use to submit metadata to the CMR. We compared the NASA and SciOps collections to understand how this choice affects the metadata content.
Data Selection
The SciOps data collection includes over 13,000 metadata records from nearly 2,000 different sources, most outside of NASA. Over 1700 of these sources have less than ten metadata records. Assuming that there is variation in metadata creation techniques for these providers, this is likely not a homogeneous collection. We identified 25 providers that have collections with one hundred or more records and examined those as separate collections. Table 1 below shows the 18 NASA provider collections (grey cells) and 25 SciOps provider collections considered in this evaluation, as well as the record count for each provider.
Table 1. Collections and record counts
| Collection | Organization | Count | Collection | Organization | Count | Collection | Organization | Count | Collection | Organization | Count | |||
| ASF | NASA | 161 | NSIDC_V0 | NASA | 784 | COLUMBIA | SCIOPS | 214 | NSIDC | SCIOPS | 187 | |||
| CDDIS | NASA | 38 | OB_DAAC | NASA | 132 | DOE | SCIOPS | 202 | NZ | SCIOPS | 857 | |||
| GES_DISC | NASA | 1044 | OMNIRT | NASA | 5 | DOIUSGSGD | SCIOPS | 128 | UCAR | SCIOPS | 437 | |||
| GHRC | NASA | 361 | ORNL_DAAC | NASA | 1216 | DOIUSGSPUBS | SCIOPS | 105 | UEA | SCIOPS | 104 | |||
| LAADS | NASA | 130 | PODAAC | NASA | 603 | DOIUSGSSESC | SCIOPS | 207 | UK | SCIOPS | 33 | |||
| LANCEAMSR2 | NASA | 6 | SEDAC | NASA | 202 | IAI-DIS | SCIOPS | 116 | UMD | SCIOPS | 169 | |||
| LANCEMODIS | NASA | 154 | USGS_EROS | NSIDC | 11 | ICSU | SCIOPS | 112 | UNEPDEWA | SCIOPS | 373 | |||
| LARC | NASA | 406 | ACADIS | SCIOPS | 393 | IOBIS | SCIOPS | 295 | UNEPROAP | SCIOPS | 162 | |||
| LARC_ASDC | NASA | 606 | AR | SCIOPS | 142 | JP | SCIOPS | 112 | USAP | SCIOPS | 190 | |||
| LPDAAC_ECS | NASA | 285 | BCO-DMO | SCIOPS | 136 | KR | SCIOPS | 329 | USC | SCIOPS | 151 | |||
| NSIDC_ECS | NASA | 223 | CN | SCIOPS | 134 | LTER | SCIOPS | 177 |
Not Provided Values
The CMR team are in the difficult position of trying to make a coherent and useful metadata repository by collecting metadata from many organizations and projects that have different goals and needs. This presents a challenge as the CMR evolves and new requirements emerge. Metadata managers need to account for content that is not provided by the metadata providers. At the current time, this is between three and five percent of the content.
The solution for both NASA provided collections and SciOps provided collection is to add the string “Not provided” to expected fields that have no content. This clearly indicates that content is missing, except that tools that read the metadata or translate it must be aware of and consider this convention to get meaningful results. The tools we use for evaluating metadata completeness are agnostic to element and attribute values. Therefore the analysis presented below, which compares NASA Complete with SciOps Complete does not include metadata fields with a value of 'Not Provided'.
NASA Collections - Fields with ‘Not Provided' values
Table 2 shows fields in the NASA Group with the 'Not provided' flag and the % of records from each data provider that include that value. In four cases these missing data flags make up over 50% of the content for fields. Elements with these missing values were not considered further in the analysis.
Table 2. Occurrences of missing data ('Not provided') in NASA collections
| Number of Records | 4 | 1044 | 50 | 154 | 305 | 2 | 11 | 19 | 783 | 16 | ||
| Paths - Data Provider | Count | CDDIS | GES_DISC | LAADS | LANCEMODIS | LARC | LARC_ASDC | LPDAAC_ECS | NSIDC_ECS | NSIDCV0 | SEDAC | Average |
| /gmi:acquisitionInformation/gmi:instrument/gmi:type | 10 | 100% | 100% | 78% | 49% | 83% | 100% | 91% | 100% | 75% | 100% | 86% |
| /gmd:contentInfo/gmd:processingLevelCode/gmd:code | 8 | 0% | 0% | 90% | 95% | 2% | 0% | 91% | 100% | 100% | 100% | 64% |
| /gmd:identificationInfo/gmd:processingLevel/gmd:code | 8 | 0% | 0% | 90% | 95% | 2% | 0% | 91% | 100% | 100% | 100% | 64% |
| /gmd:identificationInfo/gmd:abstract | 6 | 0% | 90% | 90% | 92% | 100% | 100% | 91% | 0% | 0% | 0% | 63% |
| /gmi:acquisitionInformation/gmi:platform/gmi:description | 6 | 0% | 0% | 66% | 0% | 30% | 100% | 9% | 0% | 100% | 0% | 34% |
/gmd:contentInfo/gmd:dimension/gmd:otherProperty/gco:Record/eos:AdditionalAttributes/ eos:AdditionalAttribute/eos:reference/eos:description | 5 | 0% | 87% | 68% | 1% | 0% | 0% | 91% | 0% | 100% | 0% | 39% |
| /gmd:identificationInfo/gmd:descriptiveKeywords/gmd:keyword | 4 | 0% | 0% | 66% | 0% | 30% | 100% | 0% | 0% | 53% | 0% | 28% |
| /gmd:identificationInfo/gmd:status/gmd:MD_ProgressCode | 4 | 0% | 0% | 0% | 1% | 17% | 0% | 9% | 0% | 22% | 0% | 5% |
| /gmi:acquisitionInformation/gmi:platform/gmi:identifier/gmd:code | 4 | 0% | 0% | 66% | 0% | 30% | 100% | 0% | 0% | 53% | 0% | 28% |
/gmd:identificationInfo/gmd:aggregationInfo/gmd:aggregateDataSetName/ gmd:citedResponsibleParty/gmd:contactInfo/gmd:onlineResource/gmd:linkage/gmd:URL | 4 | 0% | 100% | 0% | 100% | 0% | 0% | 0% | 0% | 100% | 100% | 44% |
| /gmi:acquisitionInformation/gmi:instrument/eos:sensor/eos:type | 3 | 0% | 0% | 0% | 1% | 4% | 0% | 0% | 0% | 0% | 0% | 0% |
| /gmd:identificationInfo/gmd:pointOfContact/gmd:individualName | 2 | 0% | 0% | 4% | 0% | 0% | 0% | 9% | 0% | 0% | 0% | 1% |
| /gmd:identificationInfo/gmd:resourceConstraints/gmd:useLimitation | 2 | 0% | 0% | 0% | 0% | 100% | 100% | 0% | 0% | 0% | 0% | 22% |
| /gmd:contact/gmd:organisationName | 1 | 0% | 0% | 0% | 0% | 0% | 0% | 0% | 100% | 0% | 0% | 11% |
| /gmd:identificationInfo/gmd:pointOfContact/gmd:organisationName | 1 | 0% | 0% | 0% | 0% | 0% | 0% | 0% | 100% | 0% | 0% | 11% |
| /gmd:distributionInfo/gmd:distributor/gmd:distributorTransferOptions/gmd:onLine/gmd:linkage/gmd:URL | 1 | 0% | 0% | 0% | 0% | 0% | 0% | 0% | 100% | 0% | 0% | 11% |
SciOps Collection - Fields with ‘Not Provided' values
Table 3 shows fields in the SciOps Group with the 'Not provided' flag and the % of SciOps records from each data provider that include that value. In eight cases these missing data flags make up over 50% of the content for fields and in three cases (processingLevelCodes and platform descriptions) the values in all records are 'Not provided'. Elements with these missing values were not considered further in the analysis.
Table 3. Occurrences of missing data ('Not provided') in SciOps collections
| Number of Records | 373 | 134 | 105 | 329 | 857 | 33 | 116 | 177 | 207 | 202 | 437 | 187 | 162 | 112 | 151 | 393 | 136 | 112 | 104 | 169 | 128 | 214 | 190 | 295 | 142 | ||
| Paths - Number of Records | Count | UNEPDEWA | CN | DOIUSGSPUBS | KR | NZ | UK | IAI-DIS | LTER | DOIUSGSSESC | DOE | UCAR | NSIDC | UNEPROAP | JP | USC | ACADIS | BCO-DMO | ICSU | UEA | UMD | DOIUSGSGD | COLUMBIA | USAP | IOBIS | AR | Average |
| /gmd:identificationInfo/gmd:processingLevel/gmd:code | 25 | 100% | 100% | 100% | 100% | 100% | 100% | 100% | 100% | 100% | 100% | 100% | 100% | 100% | 100% | 100% | 100% | 100% | 100% | 100% | 100% | 100% | 100% | 100% | 100% | 100% | 100% |
| /gmi:acquisitionInformation/gmi:platform/gmi:description | 25 | 100% | 100% | 100% | 100% | 100% | 100% | 100% | 100% | 100% | 100% | 100% | 100% | 100% | 100% | 100% | 100% | 100% | 100% | 100% | 100% | 100% | 100% | 100% | 100% | 100% | 100% |
| /gmd:contentInfo/gmd:processingLevelCode/gmd:code | 25 | 100% | 100% | 100% | 100% | 100% | 100% | 100% | 100% | 100% | 100% | 100% | 100% | 100% | 100% | 100% | 100% | 100% | 100% | 100% | 100% | 100% | 100% | 100% | 100% | 100% | 100% |
| /gmd:contentInfo/gmd:dimension/gmd:otherProperty/gco:Record/eos:AdditionalAttributes/eos:AdditionalAttribute/eos:reference/eos:description | 25 | 100% | 100% | 100% | 100% | 100% | 100% | 100% | 100% | 100% | 100% | 100% | 99% | 100% | 96% | 100% | 100% | 95% | 100% | 100% | 100% | 100% | 100% | 85% | 100% | 100% | 99% |
| /gmd:identificationInfo/gmd:citation/gmd:edition | 25 | 96% | 100% | 64% | 98% | 100% | 100% | 100% | 100% | 97% | 76% | 100% | 76% | 100% | 99% | 99% | 100% | 99% | 96% | 100% | 96% | 44% | 99% | 100% | 72% | 100% | 92% |
| /gmd:identificationInfo/gmd:citation/gmd:identifier/gmd:version | 25 | 96% | 100% | 64% | 98% | 100% | 100% | 100% | 100% | 97% | 76% | 100% | 76% | 100% | 99% | 99% | 100% | 99% | 96% | 100% | 96% | 44% | 99% | 100% | 72% | 100% | 92% |
| /gmd:identificationInfo/gmd:descriptiveKeywords/gmd:keyword | 25 | 99% | 13% | 47% | 64% | 49% | 58% | 94% | 99% | 96% | 45% | 25% | 75% | 86% | 49% | 99% | 100% | 26% | 86% | 1% | 89% | 45% | 87% | 99% | 46% | 53% | 65% |
| /gmi:acquisitionInformation/gmi:platform/gmi:identifier/gmd:code | 25 | 99% | 13% | 47% | 64% | 49% | 58% | 94% | 99% | 96% | 45% | 25% | 75% | 86% | 49% | 99% | 100% | 26% | 86% | 1% | 89% | 45% | 87% | 99% | 46% | 53% | 65% |
| /gmd:identificationInfo/gmd:status/gmd:MD_ProgressCode | 25 | 100% | 57% | 7% | 87% | 1% | 94% | 9% | 1% | 0% | 59% | 1% | 28% | 100% | 89% | 1% | 100% | 71% | 3% | 99% | 82% | 5% | 7% | 1% | 19% | 20% | 42% |
| /gmi:acquisitionInformation/gmi:instrument/gmi:type | 23 | 2% | 90% | 22% | 73% | 56% | 67% | 11% | 1% | 12% | 37% | 6% | 78% | 36% | 50% | 0% | 0% | 82% | 4% | 4% | 51% | 21% | 10% | 1% | 38% | 43% | 32% |
NASA vs. SciOps
This analysis compares item usage (elements and attributes) in the 18 NASA collection with the 25 SciOps collections. This evaluation identifies items that exist in collections as well as items that are complete in collections. In order for an item to exist in a collection it must be present in at least 1 metadata record included in the collection. In order for an item to be complete in a collection it must be present in all metadata records included in the collection.
Presentation
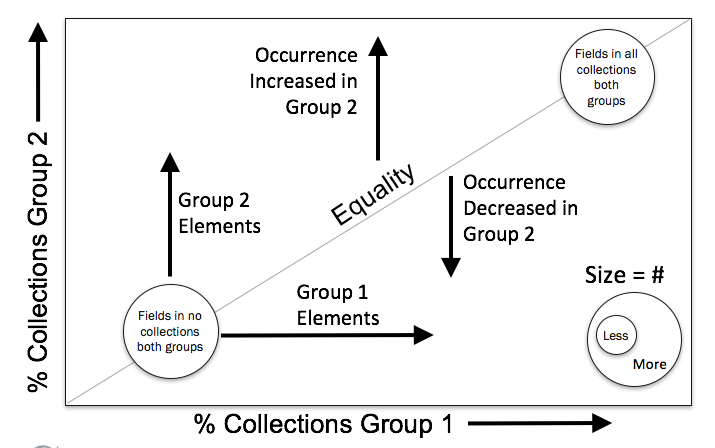
Item usage for NASA collections and SciOps collections are shown using bubble charts. The Figure 1 graphic provides a schematic for interpreting the bubble plots.
Figure 1: Bubble Chart Interpretation
NASA Complete vs SciOps Complete
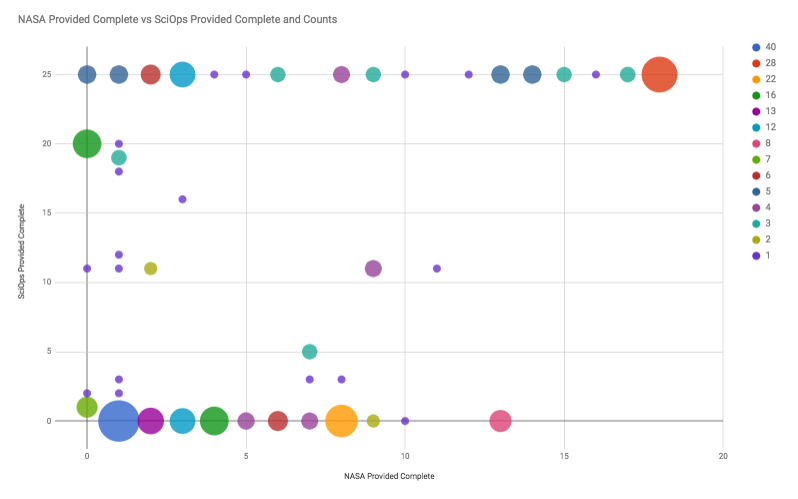
Figure 2 below compares provided item (elements and attributes) completeness in NASA Collections with SciOps collections. The X axis shows the number of NASA collections that are complete with respect to items. The Y axis shows the number of SciOps collections that are complete with respect to an items. The bubble size shows the number of items included in the 2 collections.
The large red bubble in the upper right corner of the plot represents items that are complete is all 18 NASA collections and in all 25 SciOps collections. This bubble includes 28 items, as shown in the legend. The large blue bubble in the lower left corner of the plot represents the items that are complete in 1 NASA collection and in 0 SciOps collections. This bubble includes 40 items, as shown in the legend. Click on the chart to view the data.
Figure 2: NASA Provided Complete vs SciOps Provided Complete
Accessing the Data
Click on Figure 2 to view the data in Google Sheets. The Google Sheets display is interactive. It enables data identification for each bubble, and includes a look up table for identifying the ISO items associated with the bubble. To access and use the interactive version:
- Click on the Figure 2 above to view the chart in Google Sheets
- Hover over the bubbles with your mouse to identify the number of complete NASA collections and the number of complete SciOps collections associated with the bubble. The hover identification also shows the number of items (Counts) associated with each bubble.
- To the left of the chart is a lookup table for identifying the xpaths associated with each of the bubbles. To identify the xpaths associated with a bubble, match the NASA Provided Complete and SciOps Provided Complete values (from the bubble hover) with the values in the look up table.
Elements complete in all SciOps Collections or no SciOps Collections
Figure 1 indicates that bubbles congregate near the equality line for similar collections. Bubbles congregate near the axis if collections differ significantly. The large number of bubbles near the bottom and top axis in this comparison clearly suggests significant differences between the NASA and SciOps collections. Eighty-seven of two hundred and sixty-two (87/262 = 33%) of the provided elements are complete in all SciOps collections (along top axis) and one hundred and twenty-eight (128/262 = 49%) are complete in none of the SciOps collections (along the bottom axis). In total, 82% of the elements are either complete in all or absent from all of the SciOps collections.
Elements complete in all NASA and SciOps Collections
Twenty-eight (28) items (elements and attributes) are complete in all NASA and all SciOps Collections (large orange bubble in the upper right of the chart). To identify these items, click here to access the spreadsheet and select the All NASA and All SciOps filtered view from the toolbar.
![]()
Elements complete in some NASA Collections and all SciOps Collections
Fifty-four (54) items (elements and attributes) are complete in some NASA collections and all SciOps collections (bubbles along the top axis of the chart). To identify these items, click here to access the spreadsheet and select the All SciOps and Some NASA filtered view from the toolbar.
Elements complete in some NASA Collections and no SciOps Collections
One hundred and twenty-eight (128) items (elements and attributes) are complete in some NASA collections and no SciOps collections (bubbles along the bottom of the plot). To identify these items, click here to access the spreadsheet and select the Some NASA and No SciOps filtered view from the toolbar.
NASA Exist vs SciOps Exist
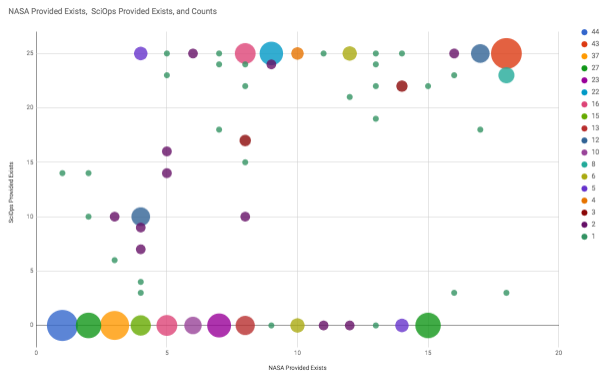
Figure 3 compares item existence in NASA Collections with SciOps collections. The X axis shows the number of NASA collections that include an item. The Y axis shows number of SciOps collections that include an item. The bubble size shows the number of items included in the 2 collections.
The large red bubble in the upper right corner of the plot shows the items (elements and attributes) that exist is all 18 NASA collections and in all 25 SciOps collections. This bubble includes 43 items, as shown in the legend. The large blue bubble in the lower left corner of the plot shows items that exist is 1 NASA collection and in 0 SciOps collections. This bubble includes 44 items, as shown in the legend. Click on the chart to view the data.
Figure 3: NASA Provided Exists vs SciOps Provided Exists
Accessing the Data
Click on Figure 3 to view the data in Google Sheets. The Google Sheets display is interactive. It enables data identification for each bubble, and includes a look up table for identifying the ISO items associated with the bubble. To access and use the interactive version:
- Click on the Figure 3 above to view the chart in Google Sheets
- Hover over the bubbles with your mouse to identify item existence in NASA collections and item existence in SciOps collections associated with the bubble. The hover identification also shows the number of items (Counts) associated with each bubble.
- To the left of the chart is a lookup table for identifying the xpaths associated with each of the bubbles. To identify the xpaths associated with a bubble, match the NASA Exists and SciOps Exists value pairs (from the bubble hover) with the value pairs in the look up table.
Elements that exist in all SciOps Collections or no SciOps Collections
Figure 1 above indicates that bubbles congregate near the equality line for similar collections. Bubbles congregate near the axis if collections differ significantly. The large number of bubbles near the bottom and top axis in this comparison clearly suggests significant differences between the NASA and SciOps collections. One hundred and seventeen of four hundred and seven (117/407 = 29%) of the provided elements exist in all SciOps collections (along top axis) and two hundred and twenty-nine (229/407 = 56%) exits in none of the SciOps collections (along the bottom axis). In total, 85% of the elements either exist in all or absent from all of the SciOps collections.
Elements that exist in all NASA and SciOps Collections
Forty-three (43) items (elements and attributes) exist in all NASA and all SciOps Collections (large orange bubble at the upper right corner of the chart). To identify these items, click here to access the spreadsheet and select the All NASA and All SciOps filtered view from the toolbar.
![]()
Elements that exist in some NASA Collections and all SciOps Collections
Seventy-four (74) items (elements and attributes) exist in some NASA collections all SciOps collections (bubbles along the top edge of the chart). To identify these items, click here to access the spreadsheet and select the All SciOps and Some NASA filtered view from the toolbar.
Elements that exist in all NASA Collections and some SciOps Collections
Nine (9) items (elements and attributes) exist in all NASA collections and a smaller number of SciOps collections (bubbles along the right edge of the chart). To identify these items, click here to access the spreadsheet and select the All NASA and Some SciOps filtered view from the toolbar.
Elements that exist in some NASA Collections and No SciOps Collections
Two hundred and twenty-nine (229) items (elements and attributes) exist in some number of NASA collections and no SciOps collections (bubbles along the lower edge of the chart). To identify these items, click here to access the spreadsheet and select the Some NASA and No SciOps filtered view from the toolbar.
Elements that exist in no NASA Collections and some SciOps Collections
There are no SciOps items that do not exist in NASA Collections.
Other Filters
Elements or Attributes
To view just the elements, click here select the Elements or the Attributes filtered view from the toolbar.
Overview
Content Tools