Page History
...
- 6/8/23 – Did not update section 'Comparing UMM-JSON transformation step(s) vs. total Transform Stage', but otherwise:
- Changed charts to use binning, which A) provides labels on x axes, and B) 'smooths out' the presence of outliers. Thus, mentions of outliers have been crossed out.
- Added date to all splunk queries (so they work as is without selecting date)
- Changed use of average and max to 95th percentile and 75th percentile, to lessen impact of outliers and because that's generally better for skewed distributions
- All descriptive text referencing the above, changed as appropriate
- Major updates to section 2: added more analysis to migrate umm step section (Table D replaced with Charts D1, D2), and corrected errors as well as added analysis to umm lib step section (updated Table E, added Charts F1, F2, F3 by metadata length, Tables G1, G2 by provider)
Section 1 -- Fetch stage vs Transform stage per request (batch)
...
- Here we check for a correlation between umm-lib transformation time and length of concept metadata in characters, and fail to observe an obvious correlation.
- Decrease in variability at the high ends occurs in bins that have too few events. (6 or even less)
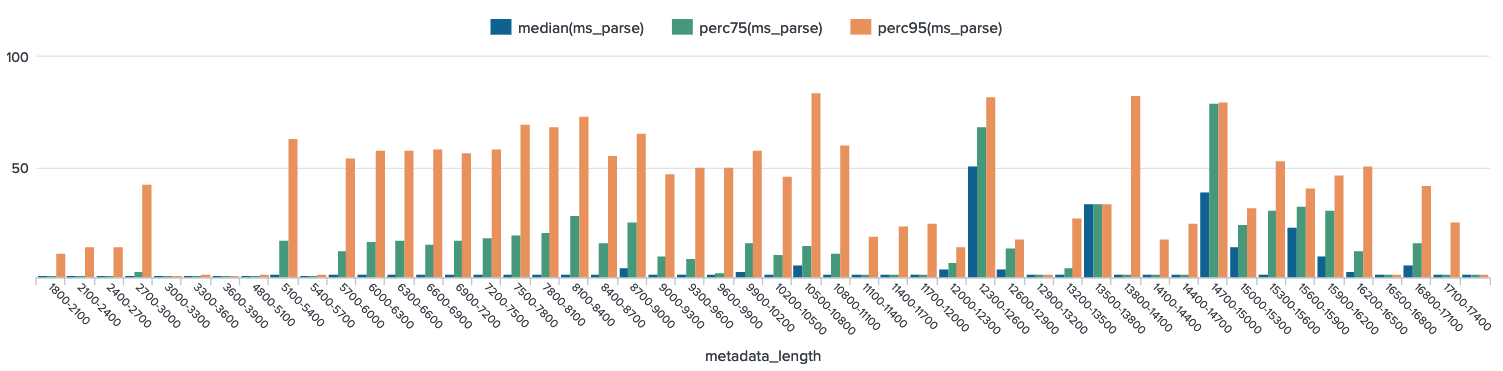
- Three graphs are shown below, so that we may examine total time, generate step time, and parse step time separately. (With median, 75th, and 95th percentile shown for each) Recall that generate step + parse step = total time.
Chart F1 - Total Time
| UI Expand | ||
|---|---|---|
| ||
log_group="cmr-search-wl" "transform-with-strategy umm-lib:" "target-formats: [{:format :umm-json" earliest="06/05/2023:00:00:00" latest="06/05/2023:23:59:00" | rex "transform-with-strategy umm-lib: legacy/parse-concept time: (?<ms_parse>\d+) reduce w/ legacy/generate-metadata time: (?<ms_generate>\d+) concept-mime-type: application/(?<mime_type>[^ ]+)" | rex "parent request num-concepts: (?<num_concepts>\d+)" | rex "provider: (?<provider>[^ ]+) metadata length: (?<metadata_length>\d+)" | where mime_type="echo10+xml" | eval ms_total = ms_parse + ms_generate | bin metadata_length span=300 | chart median(ms_total), perc75(ms_total), perc95(ms_total) over metadata_length |

Chart F2 - Generate Time
| UI Expand | ||
|---|---|---|
| ||
log_group="cmr-search-wl" "transform-with-strategy umm-lib:" "target-formats: [{:format :umm-json" earliest="06/05/2023:00:00:00" latest="06/05/2023:23:59:00" | rex "transform-with-strategy umm-lib: legacy/parse-concept time: (?<ms_parse>\d+) reduce w/ legacy/generate-metadata time: (?<ms_generate>\d+) concept-mime-type: application/(?<mime_type>[^ ]+)" | rex "parent request num-concepts: (?<num_concepts>\d+)" | rex "provider: (?<provider>[^ ]+) metadata length: (?<metadata_length>\d+)" | where mime_type="echo10+xml" | eval ms_total = ms_parse + ms_generate | bin metadata_length span=300 | chart median(ms_generate), perc75(ms_generate), perc95(ms_generate) over metadata_length |
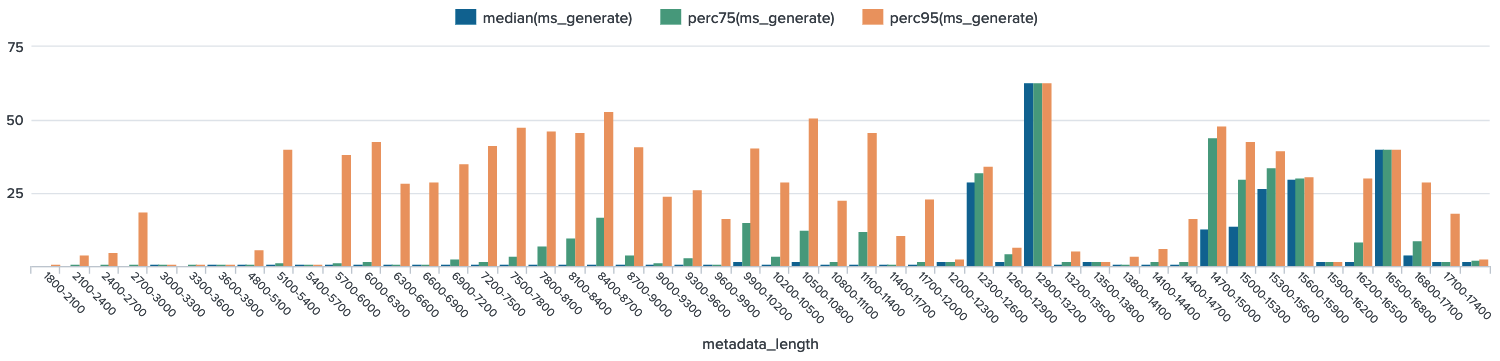
Chart F3 - Parse Time
| UI Expand | ||
|---|---|---|
| ||
log_group="cmr-search-wl" "transform-with-strategy umm-lib:" "target-formats: [{:format :umm-json" earliest="06/05/2023:00:00:00" latest="06/05/2023:23:59:00" | rex "transform-with-strategy umm-lib: legacy/parse-concept time: (?<ms_parse>\d+) reduce w/ legacy/generate-metadata time: (?<ms_generate>\d+) concept-mime-type: application/(?<mime_type>[^ ]+)" | rex "parent request num-concepts: (?<num_concepts>\d+)" | rex "provider: (?<provider>[^ ]+) metadata length: (?<metadata_length>\d+)" | where mime_type="echo10+xml" | eval ms_total = ms_parse + ms_generate | bin metadata_length span=300 | chart median(ms_parse), perc75(ms_parse), perc95(ms_parse) over metadata_length |
Tables G1, G2 - umm-lib transformation by provider
Breaking down by provider might illuminate a relationship with metadata_length. For readability, both queries below exclude 3 providers (SEDAC, ORNL_CLOUD, GES_DISC) which were severely under-represented (10 or less events).
Table G1 - total time by provider
| UI Expand | ||
|---|---|---|
| ||
log_group="cmr-search-wl" "transform-with-strategy umm-lib:" "target-formats: [{:format :umm-json" earliest="06/05/2023:00:00:00" latest="06/05/2023:23:59:00" | rex "transform-with-strategy umm-lib: legacy/parse-concept time: (?<ms_parse>\d+) reduce w/ legacy/generate-metadata time: (?<ms_generate>\d+) concept-mime-type: application/(?<mime_type>[^ ]+)" | rex "parent request num-concepts: (?<num_concepts>\d+)" | rex "provider: (?<provider>[^ ]+) metadata length: (?<metadata_length>\d+)" | where mime_type="echo10+xml" | where provider != "SEDAC" AND provider != "ORNL_CLOUD" AND provider != "GES_DISC" | eval ms_total = ms_parse + ms_generate | eval chars_per_parse_ms = metadata_length / ms_parse | eval chars_per_gen_ms = metadata_length / ms_generate | stats median(ms_total), perc75(ms_total), perc85(ms_total), perc95(ms_total), median(metadata_length), count by provider |
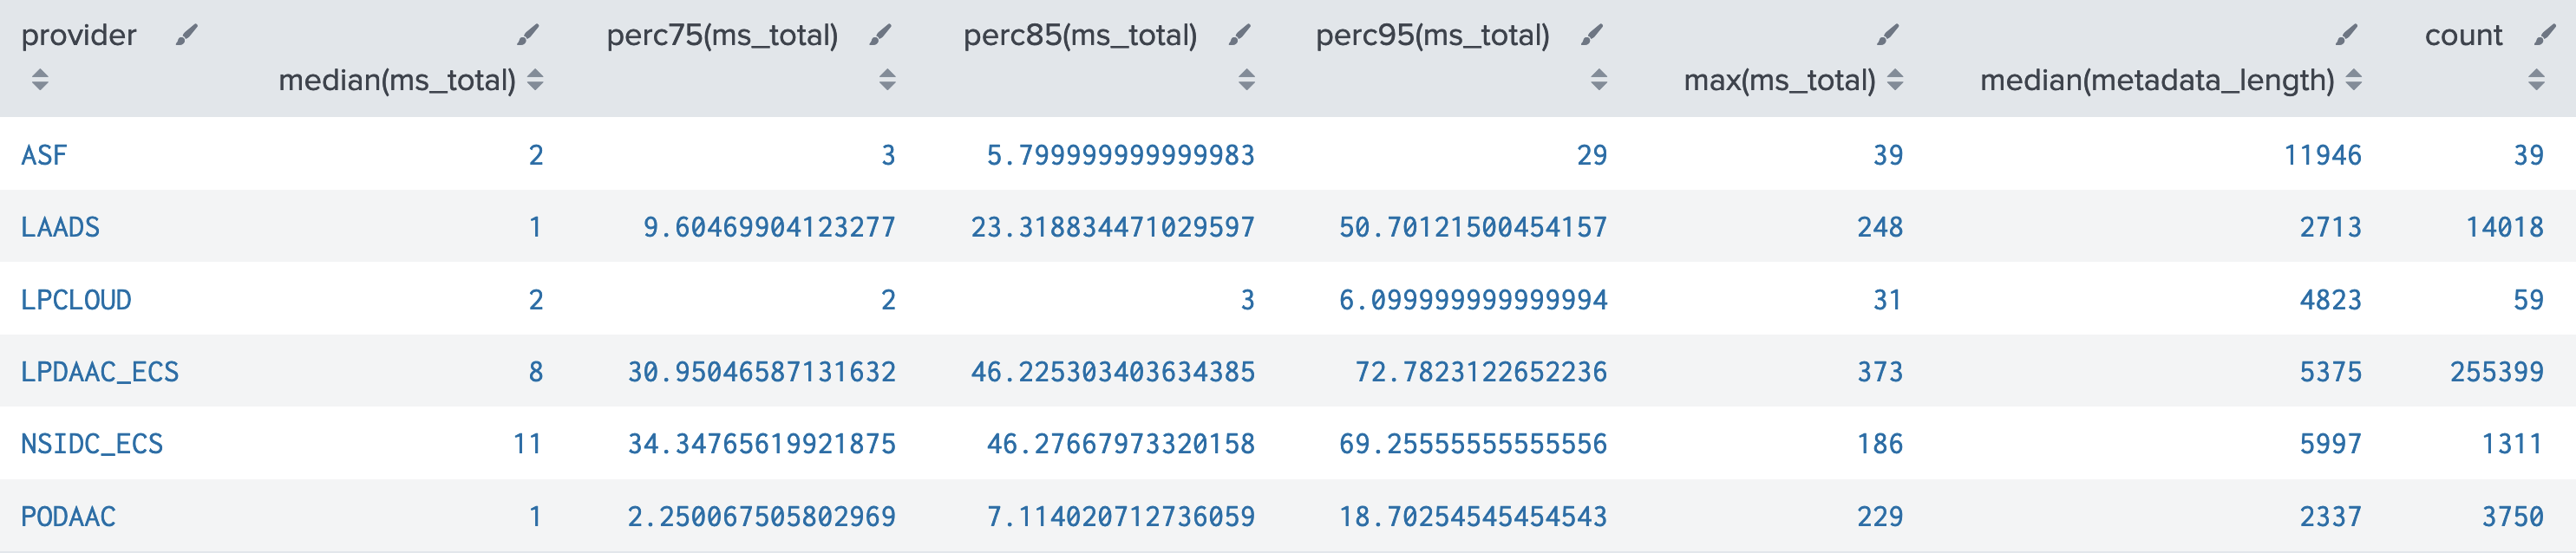
- This table shows each provider's median metadata_length (length of granule concept being transformed), alongside various percentiles, and max, of total time for the umm-lib step. The reason for so many percentiles alongside max is to check whether a provider's data might contain excessive outliers.
- LPDAAC_ECS and NSIDC_ECS are relatively slower than other providers:
- their medians (50th percentiles) are significantly higher
- their 95th percentile values are grossly higher, but even the 75th and 85th are already reaching around half the value of the 95th
- Other providers also show some slowing behavior, depending on how to define slow.
- Note that LPDAAC_ECS is the grand majority of events at 93% of the 274,576 total events
Table G2 – Metadata characters processed per millisecond, by provider
| UI Expand | ||
|---|---|---|
| ||
log_group="cmr-search-wl" "transform-with-strategy umm-lib:" "target-formats: [{:format :umm-json" earliest="06/05/2023:00:00:00" latest="06/05/2023:23:59:00" | rex "transform-with-strategy umm-lib: legacy/parse-concept time: (?<ms_parse>\d+) reduce w/ legacy/generate-metadata time: (?<ms_generate>\d+) concept-mime-type: application/(?<mime_type>[^ ]+)" | rex "parent request num-concepts: (?<num_concepts>\d+)" | rex "provider: (?<provider>[^ ]+) metadata length: (?<metadata_length>\d+)" | where mime_type="echo10+xml" | where provider != "SEDAC" AND provider != "ORNL_CLOUD" AND provider != "GES_DISC" | eval ms_total = ms_parse + ms_generate | eval chars_per_parse_ms = metadata_length / ms_parse | eval chars_per_gen_ms = metadata_length / ms_generate | stats median(metadata_length), median(chars_per_parse_ms), median(chars_per_gen_ms), perc25(chars_per_parse_ms), perc25(chars_per_gen_ms), count by provider |

- The calculated fields named "chars per ms" are the result of taking the length of the granule being transformed, and dividing by the ms it takes to transform it, for both the parse and generate steps. The resulting units are "characters processed per ms", so a lower number means less characters processed per millisecond.
- Recall that the entire metadata is processed for both parse and generate steps, but for the generate step this is more of an estimate because the starting point is not the original string, but rather the result of the parse step.
- Generally, we would expect the median "chars per ms" to be very close to the median metadata_length, for the simple reason that most of the median transform step times were 1 ms. (E.g. 1500 chars/1 ms = 1500) This is exactly what's observed, with just 2 exceptions -- again LPDAAC_ECS and NSIDC_ECS, which both show much slower median chars per ms for the parse step. (but not generate step)
- 25th percentiles for chars per ms are given in order to examine the 'slowest' (less characters processed per ms) events. Which of these might be noteworthy depends on your definition of slow, some starting points:
- LPCLOUD doesn't vary, is incredibly steady across the board
- ASF exhibits 'slower' events only for parse, not generate
- Other remaining providers all show more slowing in parse than in generate, but they do show it in both. (how much is normal?)
Overview
Content Tools