Versions Compared

Key

  • This line was added.
  • This line was removed.
  • Formatting was changed.

...

Getting Started

UI Steps
sizesmall
UI Step
NAVIGATE to https://datastudio.google.com/navigation/datasourcesui-step
UI Text Box
typenote

To use Google Data Studio, you must first ensure that your data source is available. If you currently use Google Analytics, you can set this up as a data source in Data Studio

Navigate to https://datastudio.google.com/navigation/datasources

UI Step

CLICK on Create → Data Source.

UI Step

SELECT Google Analytics as your source.

UI Step

SELECT the account you would like to use, then CLICK CONNECT.

UI Step

On this page you can choose to rename your data source and/or explore data fields. CLICK CREATE REPORT.

UI Step

Data Studio will generate a blank report and ask if you would like to add the data source. CLICK ADD TO REPORT.

UI Step

Data Studio will add a table by default. RENAME the report while in edit mode.

UI Step

Charts can be removed by selecting it and pressing the delete key. Charts can be added from the menu by CLICKING Add a chart. In this guide we will add a Smoothed time series chart.

UI Step

CLICK and DRAG on the page to insert the chart. Data studio will insert the chart and select default metrics to populate it.

UI Step

SELECT the dimensions and metrics you would like to display on the chart. Fields can be selected from the Available Fields menu. In this example we will use the metrics Users and Sessions, and the Date dimension.

UI Text Box
typetip

You can drag fields from the Available Fields column to the Dimension or Metric fields. Alternatively, you can select Add dimension or Add metric and search for the field you would like to use.

UI Step

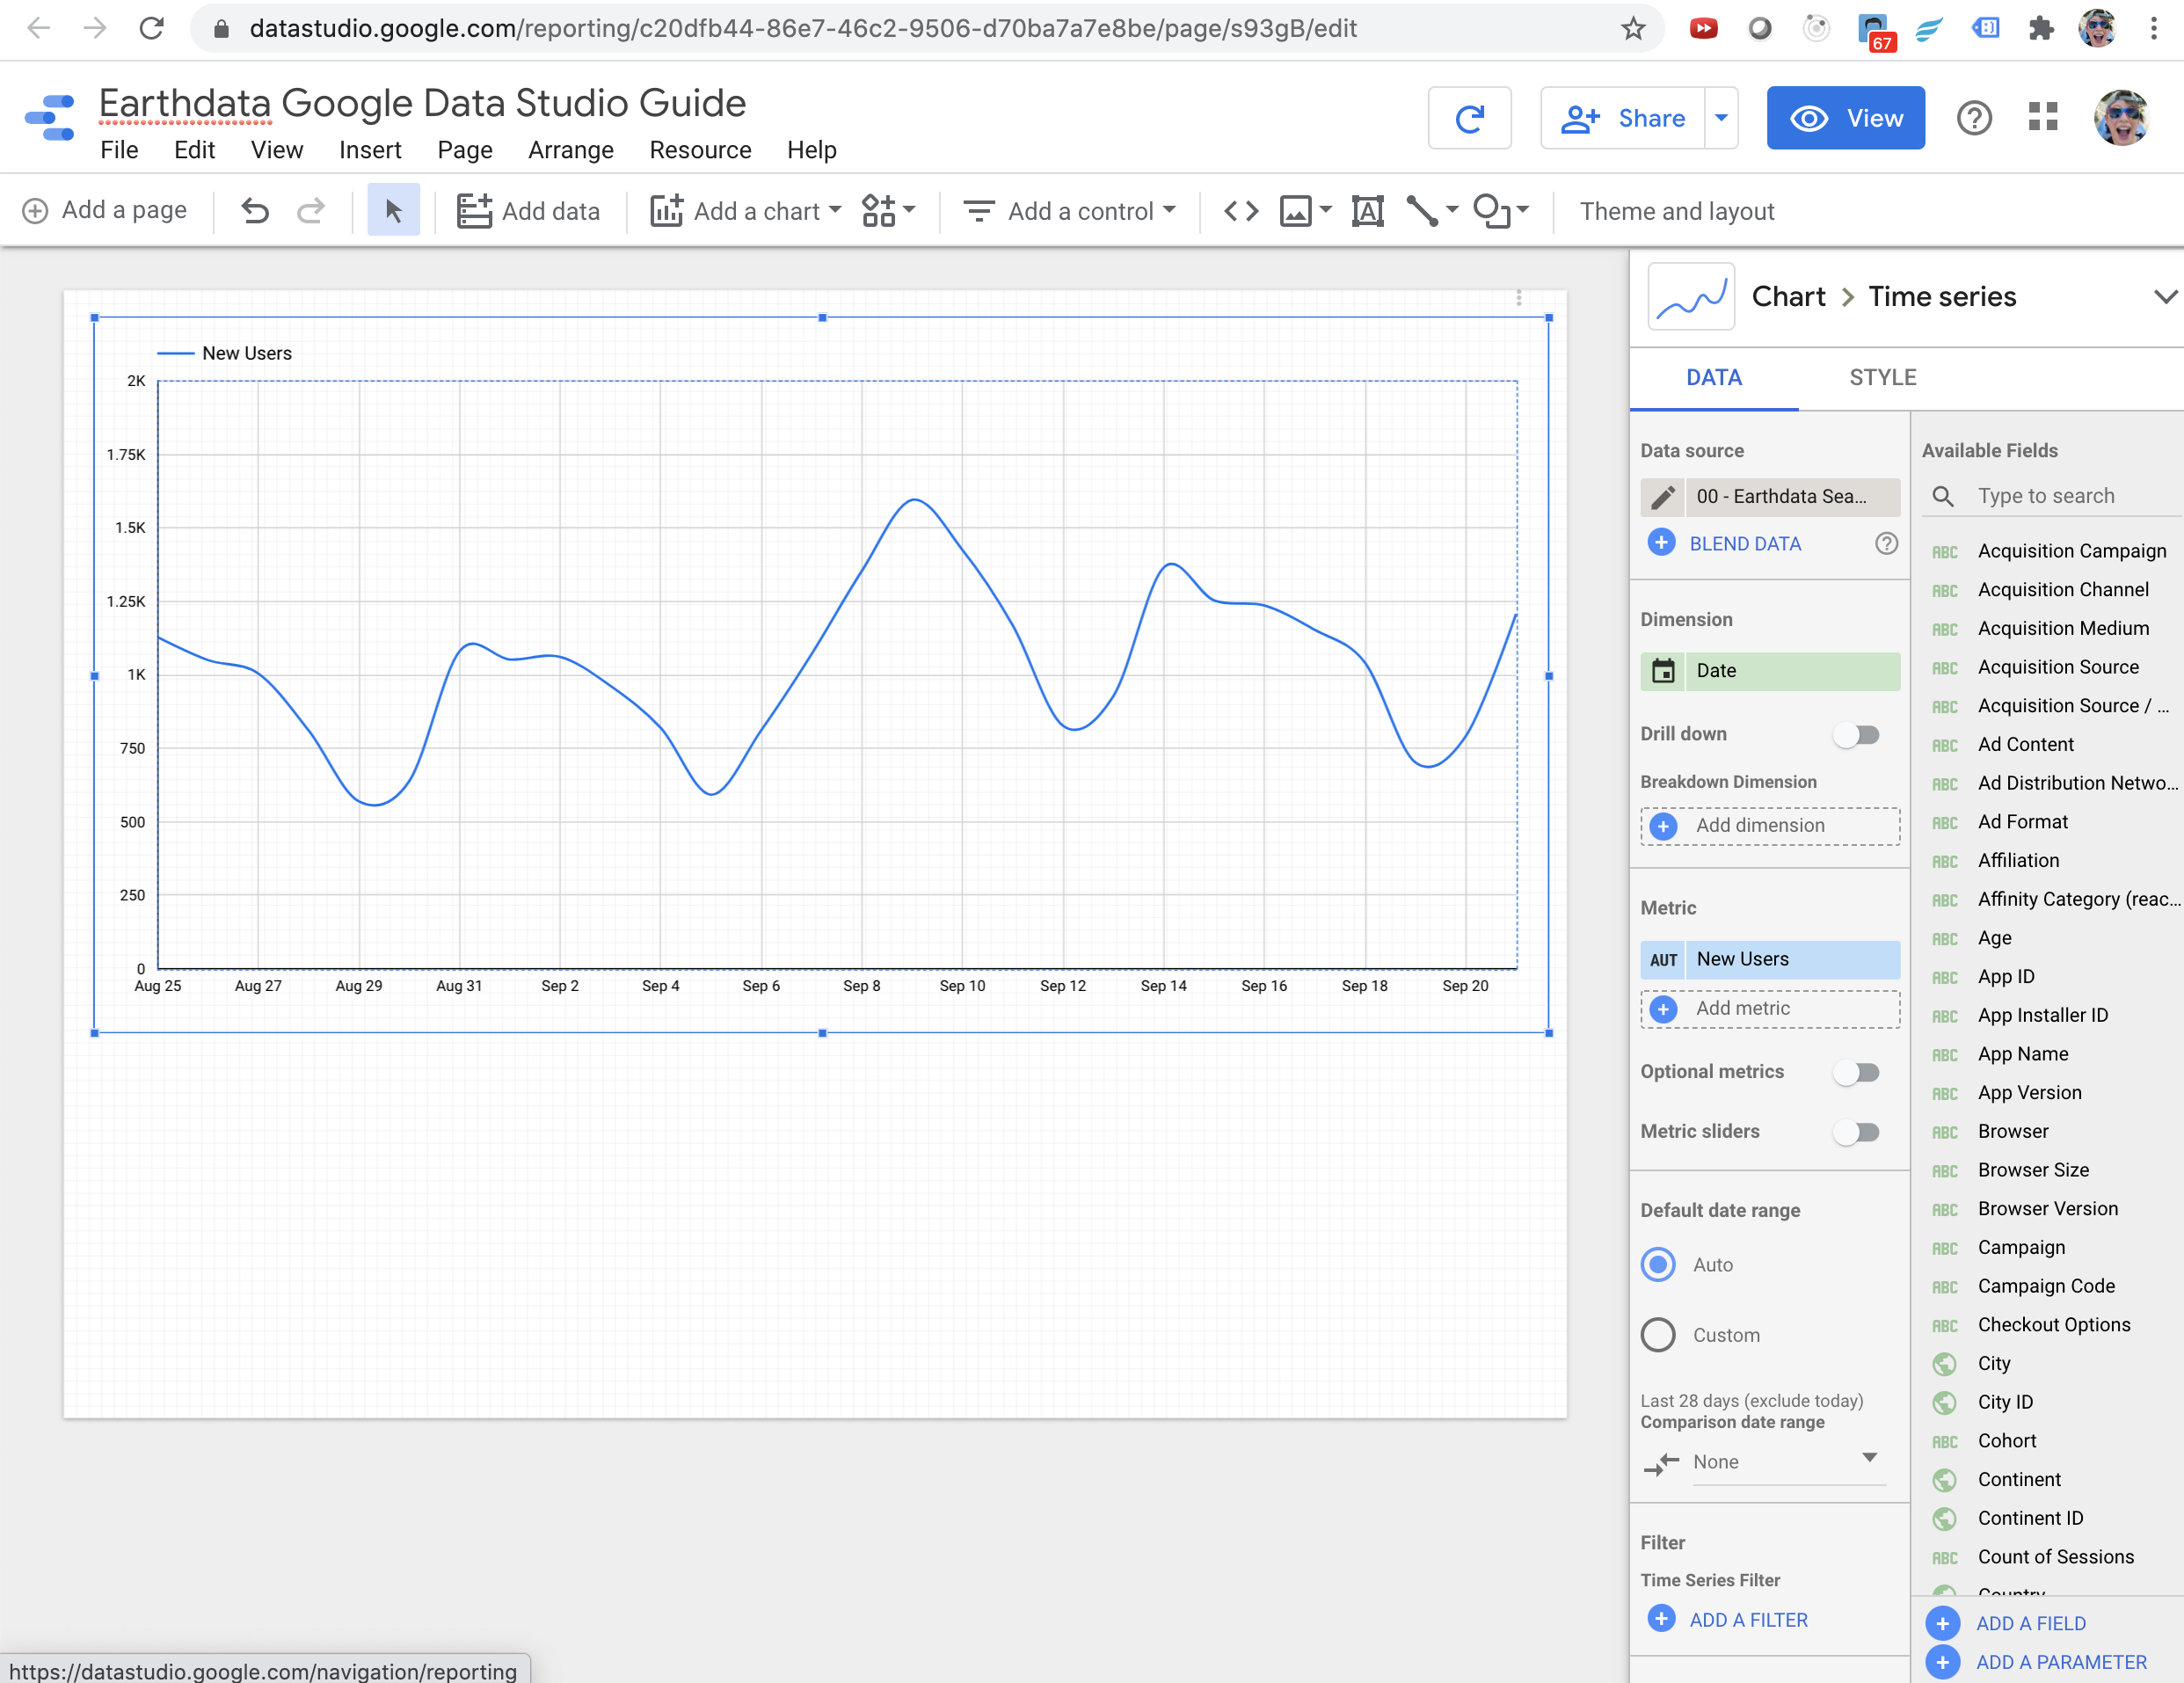
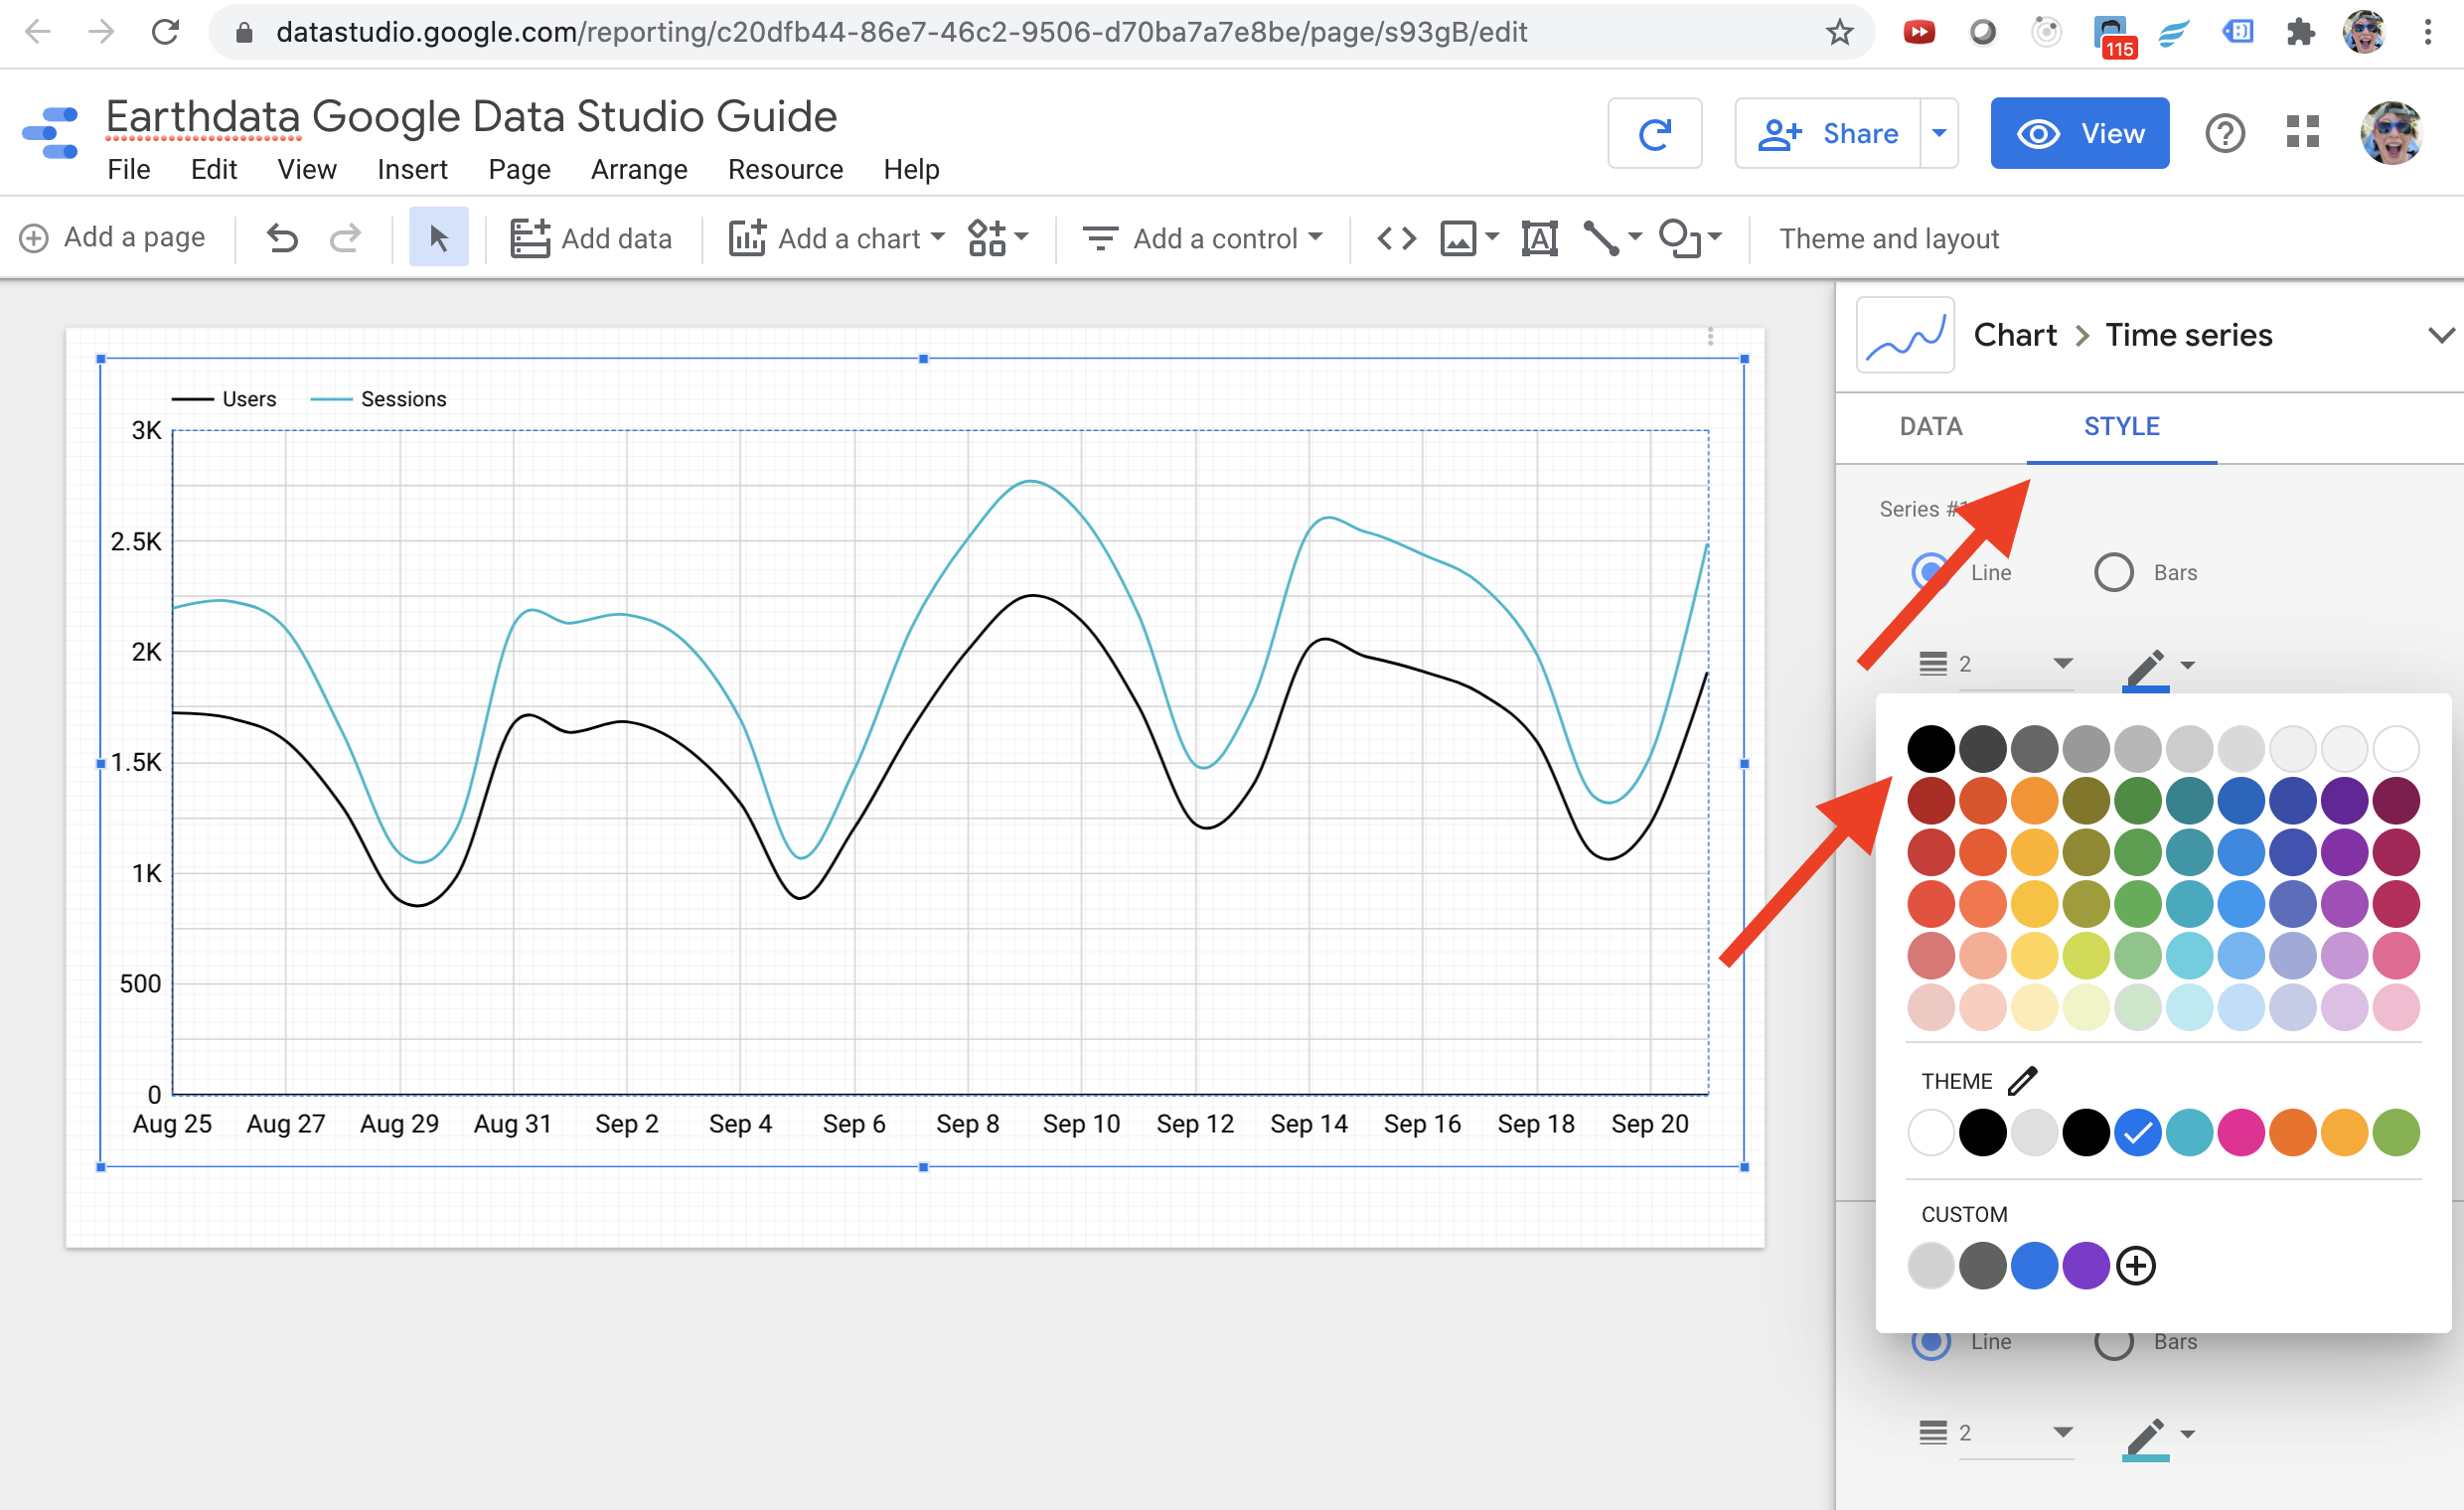
We can change the style of the individual chart by SELECTING it then CLICKING STYLE. Here you can change the font, text size, colors, data labels, trendlines, etc. In this guide I will CHANGE Series #1 to a black color. I will also scroll down and under Grid CHANGE Axis font size to 18px.

UI Text Box
typenote

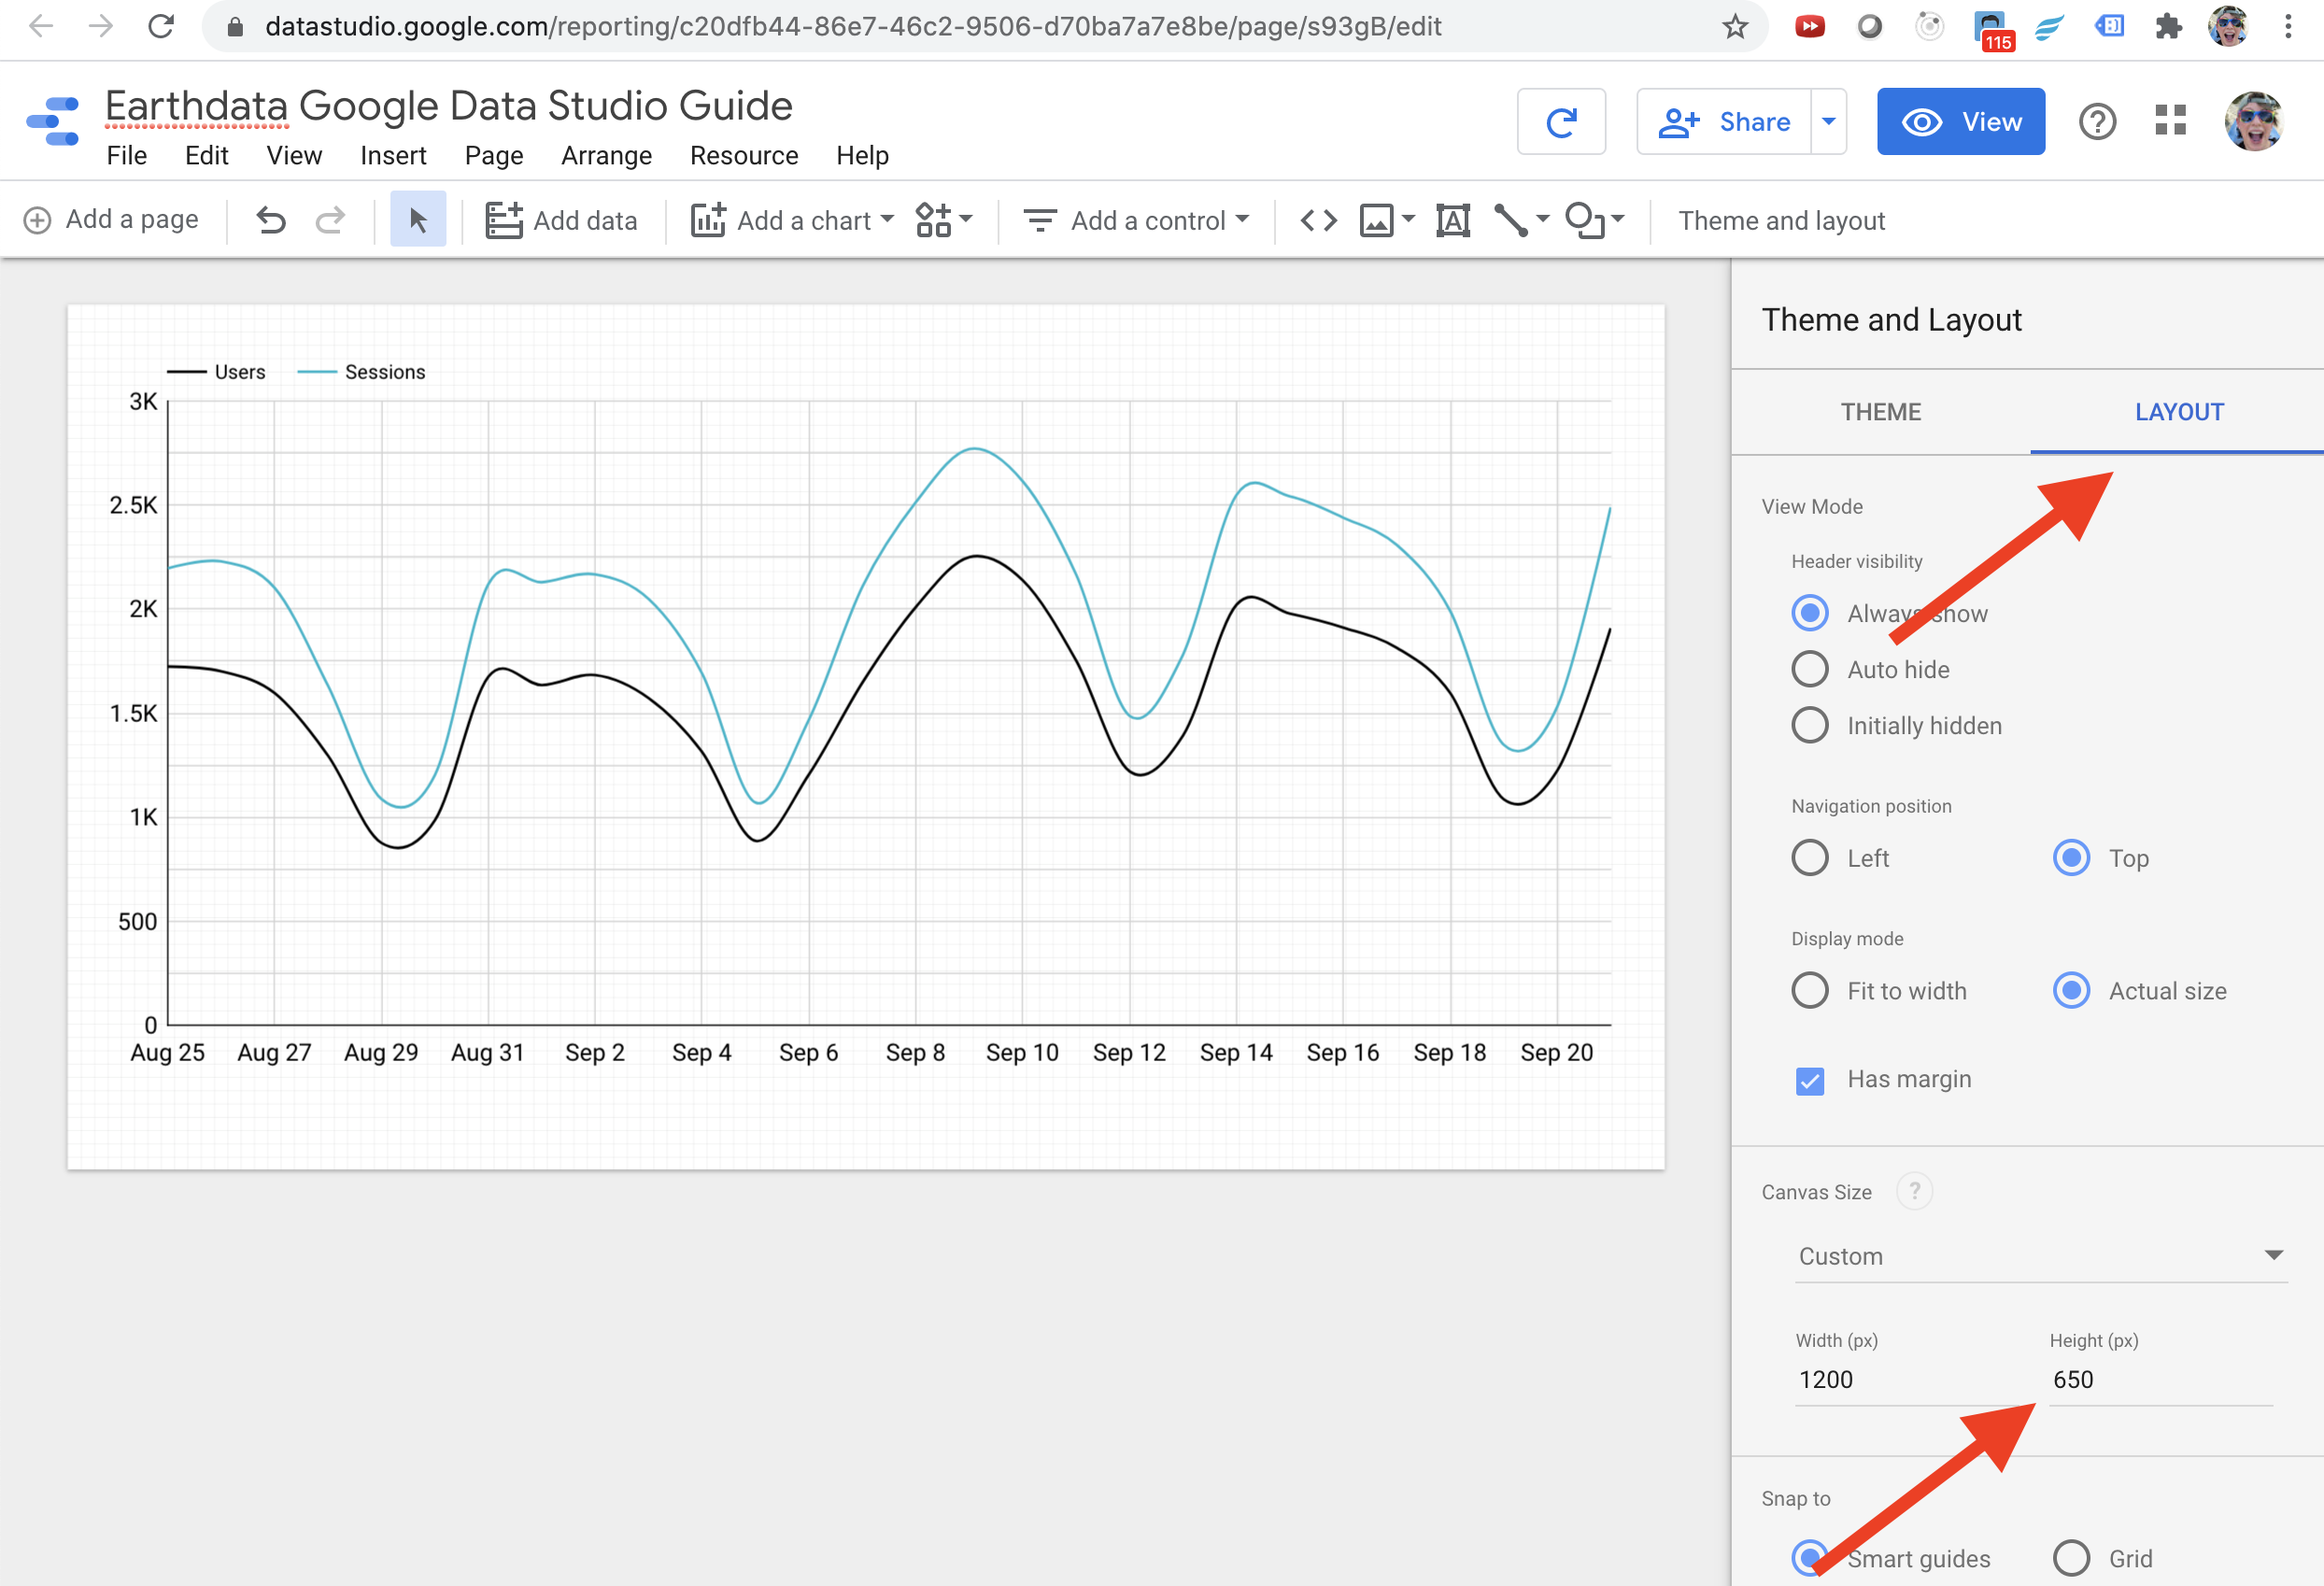
Alternatively, you can adjust the style of the entire report (not just each individual chart) by CLICKING on the report outside of any charts and SELECTING THEME. Data Studio has built in themes to select one, or you can create your own manually or based on an image. If there is a theme for the report, you can still override the default colors by going into the STYLE panel for an individual chart.

UI Step

We can also adjust the canvas size once we are done adding charts to the report. CLICK on the report outside of any charts and SELECT LAYOUT. Here we will ADJUST the Canvas Size → Height to 650px.

UI Step

Once the report is how you want it, it is important to set the sharing permissions. In the menu, CLICK on Share → Manage access.

UI Step

Next to Link sharingCLICK the default setting of Off - only specific people can access, and adjust as needed.

UI Text Box
typetip

For use on Wiki pages or sharing of reports in emails, I suggest selecting Anyone with the link can view.

UI Step

Make any other sharing adjustments needed then CLICK on Save to save changes. COPY the URL to share.

UI Step

You may also want to enable embedding for the report. CLICK on the Share dropdown menu and SELECT Embed report.

UI Step

CLICK Enable embedding. Data Studio will generate an iFrame code that can be used to embed the report in Wiki or elsewhere.

UI Text Box
typetip

Set the width/height of the embed settings to at least the canvas size of the report. If not, the report will be embedded with scroll bars so a user can see the entire thing. Sometimes, it helps to add 100 extra pixels to the height and width of the embed settings to completely avoid the scroll bars.

UI Step

From here you can make any changes to the report as necessary. To view the report as another user would see it, CLICK View.

UI Step

To make a copy of your report, when on the View screen CLICK Make a copy of this report and give the new report a new name.

UI Text Box
typewarning

It is very easy to make changes on a Data Studio report that cannot be recovered from. The UNDO action built-in to the reports sometimes doesn't work as well as I would hope. I would strongly suggest making backups of your reports.