Page History
...
Table of Contents
Overview
...
The purpose of this evaluation is compare the usage of elements in NASA metadata collections during 2016 and 2017 in order to describe and visualize how NASA metadata collections are evolving over time.
Data Selection
...
Table 1 below shows the
...
collections included in this evaluation as well as the record count and change in number of records for each collection.
...
Table 1. Collections and record counts
| Collection |
...
Organization
...
| 2016 Count | 2017 Count | Change | Collection | 2016 Count | 2017 Count |
...
| Change | |
| ASF | 84 |
...
| 161 | 77 |
...
| LPDAAC_ECS | 185 | 285 | 100 |
...
| CDDIS | 28 |
...
| 38 | 10 |
...
| NSIDC_ECS | 197 | 223 | 26 |
...
| GES_DISC |
...
| 35 |
...
| 1044 |
...
| 1009 |
...
...
| NSIDC_V0 |
...
| 784 |
...
| 784 |
...
| GHRC |
...
| 339 |
...
| 361 |
...
| 22 |
...
...
| OB_DAAC |
...
| 63 |
...
| 132 |
...
| 69 |
...
| GSFCS4PA |
...
| 687 |
...
...
| -687 |
...
406
...
LARC_ASDC
...
NASA
...
606
...
LPDAAC_ECS
...
NASA
...
285
...
NSIDC_ECS
...
NASA
...
223
...
NSIDC_V0
...
NASA
...
784
...
OB_DAAC
...
NASA
...
132
...
OMNIRT
...
NASA
...
5
...
ORNL_DAAC
...
NASA
...
1216
...
PODAAC
...
NASA
...
603
...
SEDAC
...
NASA
...
202
...
USGS_EROS
...
NSIDC
...
11
...
OTHER vs. NASA
...
| OMNIRT | 4 | 5 | 1 | |||||
| LAADS | 78 | 130 | 52 | ORNL_DAAC | 1135 | 1216 | 81 | |
| LANCEAMSR2 | 5 | 6 | 1 | PODAAC | 375 | 603 | 228 | |
| LANCEMODIS | 116 | 154 | 38 | SEDAC | 202 | 202 | ||
| LARC | 343 | 406 | 63 | USGS_EROS | 11 | 11 | 0 | |
| LARC_ASDC | 495 | 606 | 111 | Total | 4180 | 6367 | 218 |
Note:
- GSFCS4PA 2016 records were moved to the GES_DISC collection in 2017
- NSIDC_V0 and SEDAC were not included in the 2016 analysis
NASA 2016 vs NASA 2017
This analysis compares element usage in 17 NASA 2016 collections with element usage in 18 2017 collections. This evaluation identifies
...
elements which exist in collections
...
even if they are incomplete. In order for an
...
elements to exist in a collection it must be present in at least
...
one metadata record included in the collection.
...
Presentation
Element
...
usage for NASA 2016 collections and
...
NASA 2017 collections is shown
...
using
...
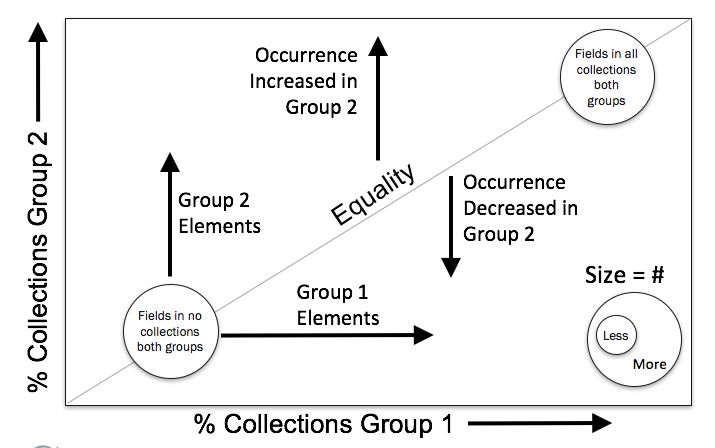
Figure 1. The bubble chart interpretation graphic provides a schematic for interpreting the bubble plots.
Figure 1. Bubble Chart Interpretation
...
...
The CMR team (NASA and Other) are in the difficult position of trying to make a coherent and useful metadata repository by collecting metadata from many organizations and projects that have different goals and needs. This presents a challenge as the CMR evolves and new requirements emerge. Metadata managers need to account for content that is not provided by the metadata providers. At the current time, this is between three and five percent of the content.
The solution for both NASA provided collections and Other provided collections is to add the string “Not provided” to expected fields that have no content. This clearly indicates that content is missing, except that tools that read the metadata or translate it must be aware of and consider this convention to get meaningful results. The tools we use for evaluating metadata completeness are agnostic to element and attribute values. Therefore the analysis presented below, which compares NASA Complete with Other Complete does not include metadata fields with a value of 'Not Provided'. Below are the metadata fields with 'Not Provided' values that were excluded from NASA Complete vs Other Complete evaluation
NASA Collections - Fields with ‘Not Provided values'
/gmi:acquisitionInformation/gmi:instrument/gmi:type
/gmd:identificationInfo/gmd:pointOfContact/gmd:organisationName
/gmd:identificationInfo/gmd:abstract
/gmd:identificationInfo/gmd:descriptiveKeywords/gmd:keyword
/gmd:identificationInfo/gmd:resourceConstraints/gmd:useLimitation
/gmd:contentInfo/gmd:processingLevelCode/gmd:code
/gmd:identificationInfo/gmd:pointOfContact/gmd:individualName
/gmi:acquisitionInformation/gmi:instrument/eos:sensor/eos:type
/gmd:contact/gmd:organisationName
/gmi:acquisitionInformation/gmi:platform/gmi:identifier/gmd:code
/gmd:contentInfo/gmd:dimension/gmd:otherProperty/gco:Record/eos:AdditionalAttributes/eos:AdditionalAttribute/eos:reference/eos:description
/gmd:identificationInfo/gmd:processingLevel/gmd:code
/gmi:acquisitionInformation/gmi:platform/gmi:description
/gmd:identificationInfo/gmd:status/gmd:MD_ProgressCode
Other Collections - Fields with ‘Not Provided values'
/gmd:identificationInfo/gmd:processingLevel/gmd:code
/gmd:identificationInfo/gmd:status/@codeListValue
/gmd:identificationInfo/gmd:citation/gmd:edition
/gmi:acquisitionInformation/gmi:platform/gmi:description
/gmd:identificationInfo/gmd:descriptiveKeywords/gmd:keyword
/gmd:contentInfo/gmd:dimension/gmd:otherProperty/gco:Record/eos:AdditionalAttributes/eos:AdditionalAttribute/eos:reference/eos:description
/gmi:acquisitionInformation/gmi:instrument/gmi:type
/gmi:acquisitionInformation/gmi:platform/gmi:identifier/gmd:code
/gmd:identificationInfo/gmd:status/gmd:MD_ProgressCode
/gmd:identificationInfo/gmd:abstract
/gmd:contentInfo/gmd:processingLevelCode/gmd:code
/gmd:identificationInfo/gmd:citation/gmd:identifier/gmd:version
NASA Complete vs OTHER Complete
...
NASA 2016 Exists vs NASA 2017 Exists
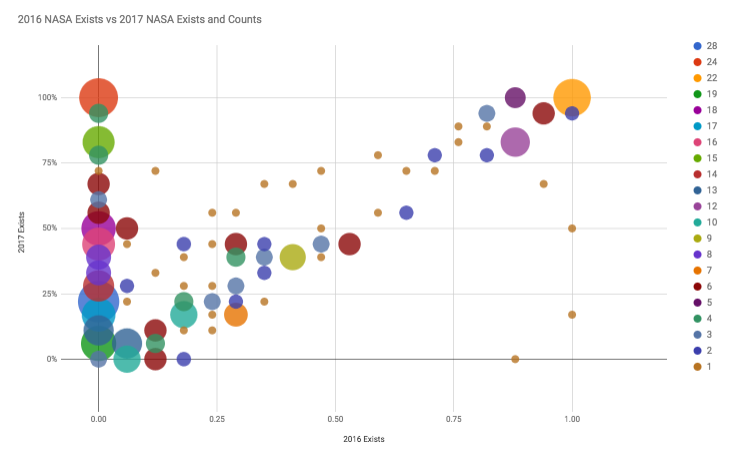
Chart 1 below compares element existence in 2016 NASA Collections with 2017 NASA collections. The X axis shows the
...
percent of NASA 2016 collections that
...
include an element. The Y axis shows
...
the percent NASA 2017 collections that include an element. The bubble size shows the number of
...
elements at each location on the chart.
The large
...
bubble in the upper
...
left corner of the plot
...
represents elements that exist is 100% of NASA 2017 collections and 0% of NASA 2016 collections. This bubble includes
...
24 elements, as shown in the legend. The large
...
bubble in the
...
upper right corner of the plot
...
represents elements that exist in 100% of NASA 2016 and 100% of NASA 2017 collections. This bubble includes
...
22 elements, as shown in the legend.
...
Click the chart or this link to view the data.
Chart 1: NASA
...
...
Data
Click on the chart graphic above to view
...
the data sheet for this chart. The data sheet enables data identification for each bubble, and includes a look up table for identifying the ISO elements associated with the bubble. To access and use the interactive version:
- Click on the chart graphic above to view the
...
- data
- Hover over the bubbles with your mouse to identify the
...
- concept existence in 2017 NASA collections and
...
- concept existence in 2016 NASA collections associated with the bubble. The hover identification also shows the number of
...
- elements (Counts) associated with each bubble.
- To the
...
- left of the chart is a lookup table for identifying the xpaths associated with each of the bubbles. To identify the xpaths associated with a bubble, match the NASA
...
- Exists and Other
...
- Exists values from the bubble hover with the values in the look up table.
NASA Exist vs OTHER Exist
Chart 2 below compares item existence (elements and attributes) in NASA Collections with Other collections. The X axis shows the number of NASA collections that include an item. The Y axis shows number of Other collections that include an item. The bubble size shows the number of items included in the 2 collections.
The large blue bubble in the upper right corner of the plot shows the items (elements and attributes) that exist is all 18 NASA collections and in all 8 Other collections. This bubble includes 51 items, as shown in the legend. The large red bubble in the lower left corner of the plot shows items that exist is 1 NASA collection and in 0 Other collections. This bubble includes 44 items, as shown in the legend. The data for Chart 2 is accessible in Google Sheets. To view the data and bubble chart in Google Sheets click on the image.
Chart 2: NASA EXIST vs Other Exists

Accessing the Chart
To access the data for this chart, click on the chart graphic above to view an interactive version in Google Sheets. The interactive version enables data identification for each bubble and includes a look up table for identifying the ISO items associated with the bubble. To access and use the interactive version:
- Click on the chart graphic above to view the chart in Google Sheets
- Hover over the bubbles with your mouse to identify the concept existence in NASA collections and concept existence in Other collections associated with the bubble. The hover identification also shows the number of items (Counts) associated with each bubble.
- To the right of the chart is a lookup table for identifying the xpaths associated with each of the bubbles. To identify the xpaths associated with a bubble, match the NASA Exists and Other Exists values from the bubble hover with the values in the look up table.
Elements in all NASA and Other Collections
Twenty-seven items (elements and attributes) are complete in all NASA and all Other Collections: See the All NASA and All Other filtered view to identify these items.
Elements in all Other Collections and some NASA Collections
Nineteen items (elements and attributes) are complete in all Other collections and complete in a smaller number of NASA collections. See the All Other and Some NASA filtered view to identify these items.
Ted please double check this filter. The table below includes 52 items not 19
Table 2. Metadata Elements that are in all Other and in a smaller number of NASA collections
Elements in some NASA Collections and no Other Collections
One hundred and fifteen items (elements and attributes) are complete in 0 Other collections and are complete some number of NASA collections. See the No Other and Some NASA filtered view to identify these items.
Other Filters
...
Elements in all NASA 2016 and NASA 2017 Collections
Twenty-two elements exist in all NASA 2016 collection and all NASA 2017 Collections. These elements are indicated in the large bubble in the upper right corner of the chart. To identify these items, click here to access the spreadsheet and select the All 2016 and All 2017 filtered view from the toolbar.
![]()
Elements in all NASA 2016 Collections and some NASA 2017 Collections
Four elements exist in all NASA 2016 Collections and in a smaller number of NASA 2017 collections. These elements are shown as three bubbles along the right edge of the chart. To identify these items, click here to access the spreadsheet and select the All 2016 and Some 2017 filtered view from the toolbar.
Elements in some NASA 2016 Collections and all NASA 2017 Collections
Five elements exist in all NASA 2017 Collections and in a smaller number of NASA 2016 collections. These elements are shown as a purple bubble on the top edge of the chart. To identify these items, click here to access the spreadsheet and select the All 2017 and Some 2016 filtered view from the toolbar.
Elements in some NASA 2016 Collections and No NASA 2017 Collections
Twenty-one elements exist in some NASA 2016 Collections and in no NASA 2017 collections. These elements are shown as bubbles along the lower edge of the chart. To identify these items, click here to access the spreadsheet and select the Some 2016 and No 2017 filtered view from the toolbar.
Elements in No NASA 2016 Collections and some NASA 2017 Collections
Forty-eight elements exist in some NASA 2017 Collections and in no NASA 2016 collections. These elements are shown as bubbles along the left edge of the chart. To identify these items, click here to access the spreadsheet and select the Some 2017 and No 2017 filtered view from the toolbar.
Overview
Content Tools