Page History
Link to First Stage of Root Cause Analysis for CMR-9094
| Table of Contents | ||
|---|---|---|
|
Document Overview
This performance analysis is based off running a 2021 production workload of search requests, examining only those requests with target format of UMM-JSON. The search requests were run using LogMiner (which parses a set of production logs and fires the same search requests it reads), with default pacing on full workload environment, against a modified version of CMR that had key functions wrapped with a 'time-execution' function that reports how long those take, along with extra logs to report those times. Logs captured the milliseconds (ms) that a request takes in 2 key areas:
...
- It is standard advice to use
medianinstead ofavg(mean/average) when looking at data that is highly variable with many outliers that have extreme values, as we have here. - At the same time, to some extent outliers are of interest, because the pressing question is moreso "how can we improve those requests which are slow" over improving all requests. For that reason,
avgis used alongsidemedianwhere appropriate.
Section 1 -- Fetch stage vs Transform stage per request (batch)
These are search requests limited to target format UMM-JSON, and all are granule requests. (Collection requests hit a different function than the one tracked through this log.) Regardless, all splunk queries below contain where concept_type = ":granule" for the sake of queries being informative and re-usable.
Total number of events: 5,030
Chart A - time taken in Fetch stage vs Transform stage over Num. of Granules per search request
...
| title | splunk query |
|---|
log_group="cmr-search-wl" "fetch of" "target-format: {:format :umm-json"
earliest="06/05/2023:00:00:00" latest="06/05/2023:23:59:00"
| rex "fetch of (?<num_concepts>\d+) concepts: target-format: {:format :umm-json, :version (?<version>[^ ]+)} get-concepts: (?<ms_fetch>\d+) metadata-transformer/transform-concepts: (?<ms_transform>\d+) concept-type: (?<concept_type>[^ ]+)"
- 95th percentiles and 75th percentiles are shown alongside median where appropriate in order to give a sense of distribution/variance without showing highest outliers in these skewed distributions
Change log
- 6/8/23 – Did not update section 'Comparing UMM-JSON transformation step(s) vs. total Transform Stage', but otherwise:
- Changed charts to use binning, which A) provides labels on x axes, and B) 'smooths out' the presence of outliers. Thus, mentions of outliers have been crossed out.
- Added date to all splunk queries (so they work as is without selecting date)
- Changed use of average and max to 95th percentile and 75th percentile, to lessen impact of outliers and because that's generally better for skewed distributions
- All descriptive text referencing the above, changed as appropriate
- Major updates to section 2: added more analysis to migrate umm step section (Table D replaced with Charts D1, D2), and corrected errors as well as added analysis to umm lib step section (updated Table E, added Charts F1, F2, F3 by metadata length, Tables G1, G2 by provider)
Section 1 -- Fetch stage vs Transform stage per request (batch)
...
These are search requests limited to target format UMM-JSON, and all are granule requests. (Collection requests hit a different function than the one tracked through this log.) Regardless, all splunk queries below contain
where concept_type = ":granule"
...
| bin num_concepts span=10
| chart median(ms_fetch), median(ms_transform), perc95(ms_transform) by num_concepts
for the sake of queries being informative and re-usable.
Total number of events: 5,030
Chart A - time taken in Fetch stage vs Transform stage over Num. of Granules per search request
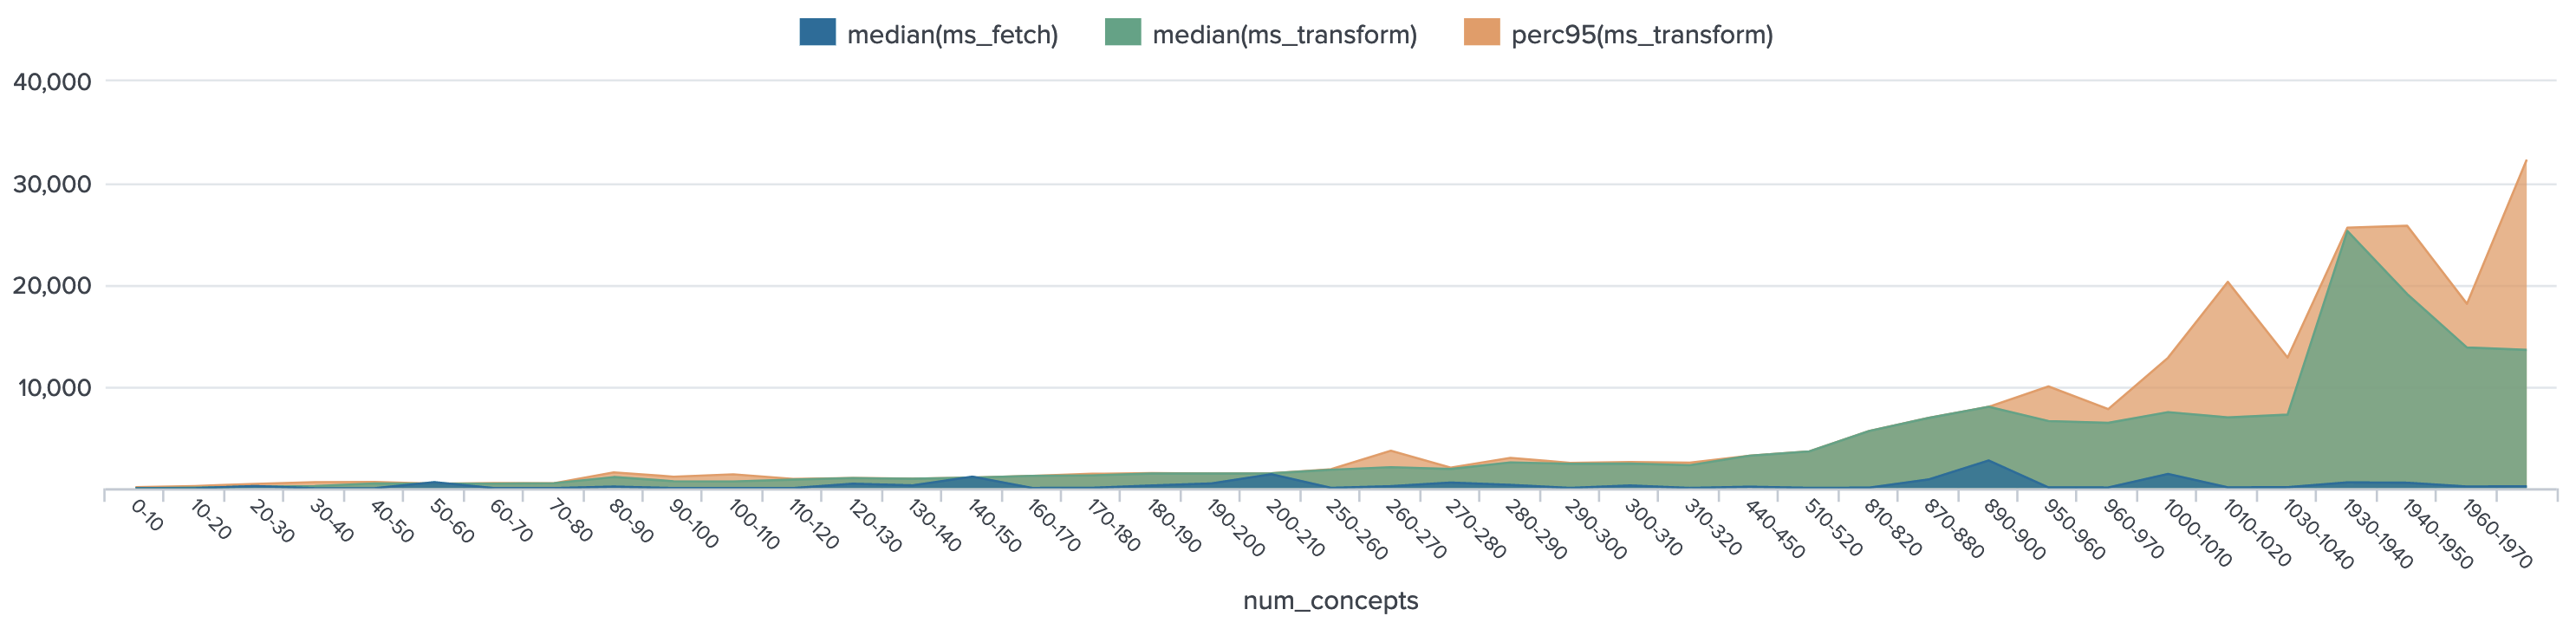
- Transform stage time overtakes Fetch stage as number of granules requested grows larger
- Note that Transform time 95th percentile (orange) significantly differs from the median (green) in the num_concepts range above 890 (implying greater variation and presence of outliers in this higher range)
...
| UI Expand | ||
|---|---|---|
| ||
log_group="cmr-search-wl" "fetch of" "target-format: {:format :umm-json" earliest="06/05/2023:00:00:00" latest="06/05/2023:23:59:00" | rex "fetch of (?<num_concepts>\d+) concepts: target-format: {:format :umm-json, :version (?<version>[^ ]+)} get-concepts: (?<ms_fetch>\d+) metadata-transformer/transform-concepts: (?<ms_transform>\d+) concept-type: (?<concept_type>[^ ]+)" | where concept_type = ":granule" | eval tf_ratio = ms_transform / ms_fetch | eval ms_total = ms_fetch + ms_transform | eval num_concepts_category = case( num_concepts < 10, "A (<10 concepts)", num_concepts >= 10 AND num_concepts < 50, "B (10-49 concepts)", num_concepts >= 50 AND num_concepts < 500, "C (50-499 concepts)", num_concepts >= 500 AND num_concepts < 900, "D (500-899 concepts)", num_concepts >= 900, "E (>=900 concepts)" ) | stats median(ms_fetch) as median_fetch, median(ms_transform) as median_transform, median(ms_total) as median_total, median(tf_ratio) as median_transform_to_fetch_ratio, count by num_concepts_category |
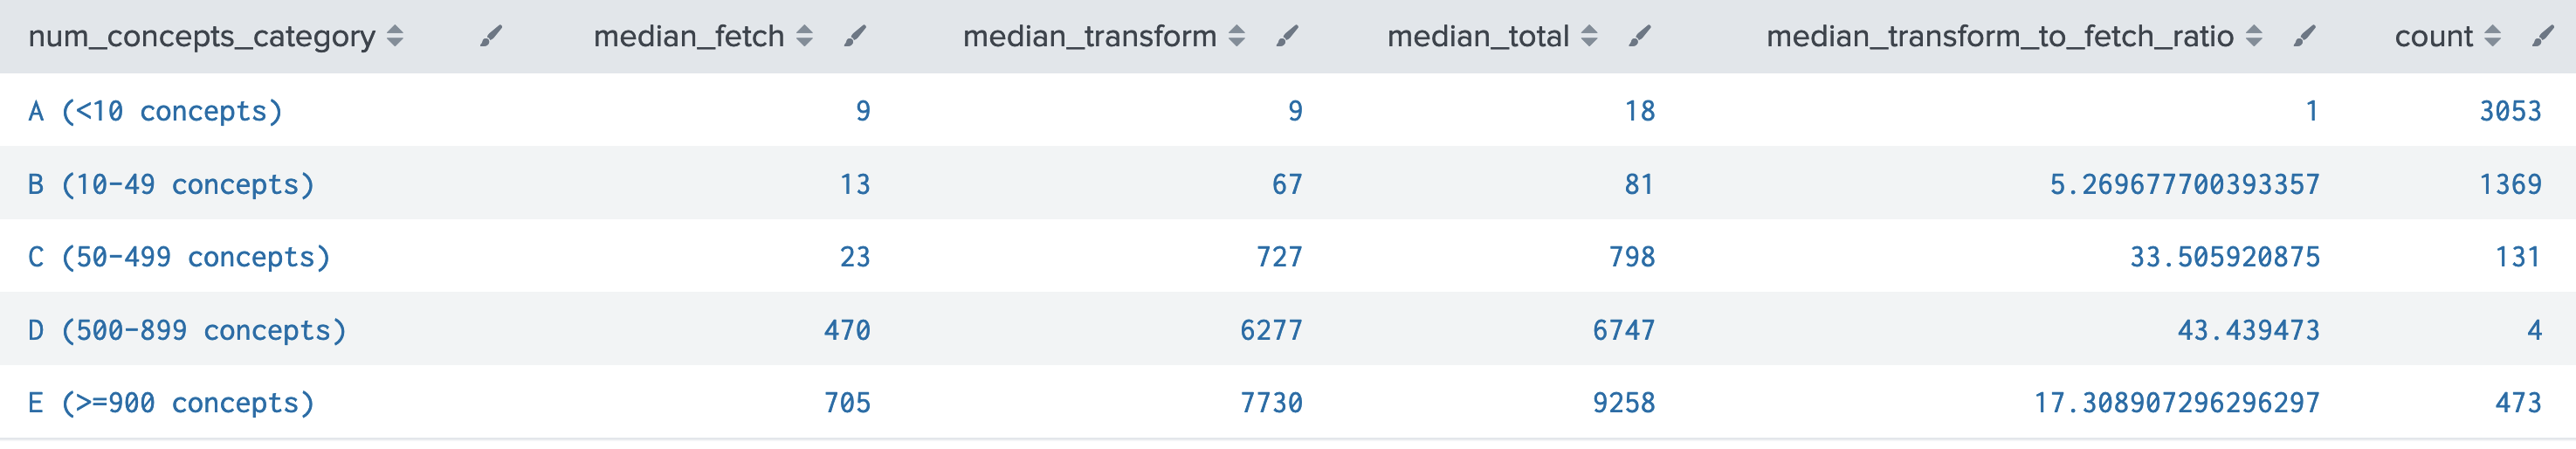
- Well over half of all UMM-JSON searches request less than 10 concepts, and another quarter request less than 50.
- As number of granules requested increases, Transform stage takes a longer proportion of total time, and its time grows faster than that of Fetch stage.
- The '500-899 concepts' category is very small (insignificant), which likely explains its funky values.
- The median_transform_to_fetch_ratio column is simply Transform time / Fetch time.
Table C - Time Per Granule Returned
| UI Expand | ||
|---|---|---|
| ||
log_group="cmr-search-wl" "fetch of" "target-format: {:format :umm-json" earliest="06/05/2023:00:00:00" latest="06/05/2023:23:59:00" | rex "fetch of (?<num_concepts>\d+) concepts: target-format: {:format :umm-json, :version (?<version>[^ ]+)} get-concepts: (?<ms_fetch>\d+) metadata-transformer/transform-concepts: (?<ms_transform>\d+) concept-type: (?<concept_type>[^ ]+)" | where concept_type = ":granule" | eval ms_per_concept = (ms_fetch + ms_transform) / num_concepts | eval ms_fetch_per_concept = ms_fetch / num_concepts | eval ms_transform_per_concept = ms_transform / num_concepts | eval num_concepts_category = case( num_concepts < 10, "A (<10 concepts)", num_concepts >= 10 AND num_concepts < 50, "B (10-49 concepts)", num_concepts >= 50 AND num_concepts < 500, "C (50-499 concepts)", num_concepts >= 500 AND num_concepts < 900, "D (500-899 concepts)", num_concepts >= 900, "E (>=900 concepts)" ) | stats median(ms_fetch_per_concept) as med_fetch_per_gran, perc75(ms_fetch_per_concept) as p75_fetch_per_gran, perc95(ms_fetch_per_concept) as p95_fetch_per_gran, median(ms_transform_per_concept) as med_tran_per_gran, perc75(ms_transform_per_concept) as p75_tran_per_gran, perc95(ms_transform_per_concept) as p95_tran_per_gran by num_concepts_category |

- These are calculated times per concept, arrived at by simply dividing total stage time by number of granules in request. Recall that the median is the 50th percentile, shown alongside 75th and 95th percentiles for both Fetch and Transform stages.
- Fetch time per granule steadily decreases as number of granules requested increases. Transform time per granule is relatively more stable.
- When number of concepts is <50, there is much greater variation in time per granule for both stages, as indicated by 75th and 95th percentiles being quite different from the median.
Section 2 -- Per granule transformation step times
The entire transform stage for 1 request consists of: mapping over the batch of concepts, for each one selecting a transformation strategy, executing it, and attaching the result to the concept. For UMM-JSON, the relevant transformation strategies are "umm-lib" (granules only) and "migrate-umm" (for when both target format and original format are both UMM-JSON); their execution was timed.
Note: these logs capture steps that are used for both collections and granules, but for this report, all queries below have been limited to granules. Future section examining collections can be added if desired.
:migrate-umm transformation (umm to umm only)
This transformation has one step, the migration from the original UMM-JSON version to the desired version. The source_version field indicates the original version, and target_version indicates the version to convert to. Limited here to granules.
Total events (each one concept): 320,079
Chart D1 - Migration time vs metadata length
| UI Expand | ||
|---|---|---|
| ||
log_group="cmr-search-wl" "transform-with-strategy migrate-umm-json" earliest="06/05/2023:00:00:00" latest="06/05/2023:23:59:00" | rex "transform-with-strategy migrate-umm-json: time: (?<ms_migrate>\d+)" | rex "concept-type: (?<concept_type>[^ ]+) parent request num-concepts: (?<num_concepts>\d+)" | rex field=_raw "target-formats:\s+\[\{[^,]+,\s+:version\s+\"(?<target_version>[^\"]+)\"" | rex "source version: (?<source_version>[^ ]+) provider: (?<provider>[^ ]+) metadata length: (?<metadata_length>\d+)" | where concept_type = ":granule" | bin metadata_length span=200 | chart median(ms_migrate), perc75(ms_migrate), perc95(ms_migrate) by metadata_length |
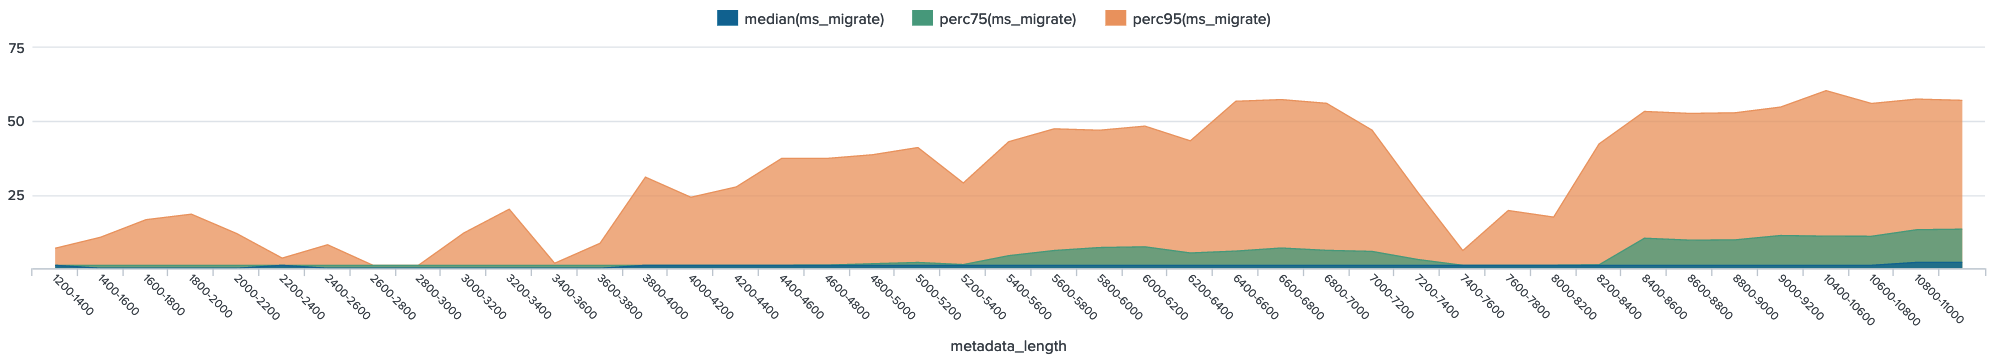
- Here we compare the median migration time as well as 75th and 95th percentiles over the length of the metadata of the granule being migrated.
- Median (blue) is barely visible in this graph because the median values are 1 ms across the board, except for the very final range of 10,750 char to 11,100 char where the medians become 2 ms.
- A slight positive correlation with metadata length is visible for the 75th percentiles of migration times, and a moderate one for the 95th percentile.
- Note that the 95th percentiles occur much further apart from the 75th percentiles, than the 75th percentiles to the medians (50th percentiles). This implies the presence of extreme outliers, and does occur for almost all metadata_length ranges, though moreso for the higher ranges.
bin num_concepts span=10 | chart median(ms_fetch), median(ms_transform), perc95(ms_transform) by num_concepts |
- Transform stage time overtakes Fetch stage as number of granules requested grows larger
- Note that Transform time 95th percentile (orange) significantly differs from the median (green) in the num_concepts range above 890 (implying greater variation and presence of outliers in this higher range)
Table B - Searches Grouped by Num. of Granules in Request
| UI Expand | ||
|---|---|---|
| ||
log_group="cmr-search-wl" "fetch of" "target-format: {:format :umm-json" earliest="06/05/2023:00:00:00" latest="06/05/2023:23:59:00" | rex "fetch of (?<num_concepts>\d+) concepts: target-format: {:format :umm-json, :version (?<version>[^ ]+)} get-concepts: (?<ms_fetch>\d+) metadata-transformer/transform-concepts: (?<ms_transform>\d+) concept-type: (?<concept_type>[^ ]+)" | where concept_type = ":granule" | eval tf_ratio = ms_transform / ms_fetch | eval ms_total = ms_fetch + ms_transform | eval num_concepts_category = case( num_concepts < 10, "A (<10 concepts)", num_concepts >= 10 AND num_concepts < 50, "B (10-49 concepts)", num_concepts >= 50 AND num_concepts < 500, "C (50-499 concepts)", num_concepts >= 500 AND num_concepts < 900, "D (500-899 concepts)", num_concepts >= 900, "E (>=900 concepts)" ) | stats median(ms_fetch) as median_fetch, median(ms_transform) as median_transform, median(ms_total) as median_total, median(tf_ratio) as median_transform_to_fetch_ratio, count by num_concepts_category |
- Well over half of all UMM-JSON searches request less than 10 concepts, and another quarter request less than 50.
- As number of granules requested increases, Transform stage takes a longer proportion of total time, and its time grows faster than that of Fetch stage.
- The '500-899 concepts' category is very small (insignificant), which likely explains its funky values.
- The median_transform_to_fetch_ratio column is simply Transform time / Fetch time.
Table C - Time Per Granule Returned
| UI Expand | ||
|---|---|---|
| ||
log_group="cmr-search-wl" "fetch of" "target-format: {:format :umm-json" earliest="06/05/2023:00:00:00" latest="06/05/2023:23:59:00" | rex "fetch of (?<num_concepts>\d+) concepts: target-format: {:format :umm-json, :version (?<version>[^ ]+)} get-concepts: (?<ms_fetch>\d+) metadata-transformer/transform-concepts: (?<ms_transform>\d+) concept-type: (?<concept_type>[^ ]+)" | where concept_type = ":granule" | eval ms_per_concept = (ms_fetch + ms_transform) / num_concepts | eval ms_fetch_per_concept = ms_fetch / num_concepts | eval ms_transform_per_concept = ms_transform / num_concepts | eval num_concepts_category = case( num_concepts < 10, "A (<10 concepts)", num_concepts >= 10 AND num_concepts < 50, "B (10-49 concepts)", num_concepts >= 50 AND num_concepts < 500, "C (50-499 concepts)", num_concepts >= 500 AND num_concepts < 900, "D (500-899 concepts)", num_concepts >= 900, "E (>=900 concepts)" ) | stats median(ms_fetch_per_concept) as med_fetch_per_gran, perc75(ms_fetch_per_concept) as p75_fetch_per_gran, perc95(ms_fetch_per_concept) as p95_fetch_per_gran, median(ms_transform_per_concept) as med_tran_per_gran, perc75(ms_transform_per_concept) as p75_tran_per_gran, perc95(ms_transform_per_concept) as p95_tran_per_gran by num_concepts_category |
- These are calculated times per concept, arrived at by simply dividing total stage time by number of granules in request. Recall that the median is the 50th percentile, shown alongside 75th and 95th percentiles for both Fetch and Transform stages.
- Fetch time per granule steadily decreases as number of granules requested increases. Transform time per granule is relatively more stable.
- When number of concepts is <50, there is much greater variation in time per granule for both stages, as indicated by 75th and 95th percentiles being quite different from the median.
Section 2 -- Per granule transformation step times
The entire transform stage for 1 request consists of: mapping over the batch of concepts, for each one selecting a transformation strategy, executing it, and attaching the result to the concept. For UMM-JSON, the relevant transformation strategies are "umm-lib" (granules only) and "migrate-umm" (for when both target format and original format are both UMM-JSON); their execution was timed.
Note: these logs capture steps that are used for both collections and granules, but for this report, all queries below have been limited to granules. Future section examining collections can be added if desired.
:migrate-umm transformation (umm to umm only)
This transformation has one step, the migration from the original UMM-JSON version to the desired version. The source_version field indicates the original version, and target_version indicates the version to convert to. Limited here to granules.
Total events (each one concept): 320,079
Chart D1 - Migration time vs metadata length
| UI Expand | ||
|---|---|---|
| ||
log_group="cmr-search-wl" "transform-with-strategy migrate-umm-json" earliest="06/05/2023:00:00:00" latest="06/05/2023:23:59:00" | rex "transform-with-strategy migrate-umm-json: time: (?<ms_migrate>\d+)" | rex "concept-type: (?<concept_type>[^ ]+) parent request num-concepts: (?<num_concepts>\d+)" | rex field=_raw "target-formats:\s+\[\{[^,]+,\s+:version\s+\"(?<target_version>[^\"]+)\"" | rex "source version: (?<source_version>[^ ]+) provider: (?<provider>[^ ]+) metadata length: (?<metadata_length>\d+)" | where concept_type = ":granule" | bin metadata_length span=200 | chart median(ms_migrate), perc75(ms_migrate), perc95(ms_migrate) by metadata_length |
- Here we compare the median migration time as well as 75th and 95th percentiles over the length of the metadata of the granule being migrated.
- Median (blue) is barely visible in this graph because the median values are 1 ms across the board, except for the very final range of 10,750 char to 11,100 char where the medians become 2 ms.
- A slight positive correlation with metadata length is visible for the 75th percentiles of migration times, and a moderate one for the 95th percentile.
- Note that the 95th percentiles occur much further apart from the 75th percentiles, than the 75th percentiles to the medians (50th percentiles). This implies the presence of extreme outliers, and does occur for almost all metadata_length ranges, though moreso for the higher ranges.
Chart D2 - migration step time vs version distanceChart D2 - migration step time vs version distance
| UI Expand | ||
|---|---|---|
| ||
log_group="cmr-search-wl" "transform-with-strategy migrate-umm-json" earliest="06/05/2023:00:00:00" latest="06/05/2023:23:59:00" | rex "transform-with-strategy migrate-umm-json: time: (?<ms_migrate>\d+)" | rex "concept-type: (?<concept_type>[^ ]+) parent request num-concepts: (?<num_concepts>\d+)" | rex field=_raw "target-formats:\s+\[\{[^,]+,\s+:version\s+\"(?<target_version>[^\"]+)\"" | rex "source version: (?<source_version>[^ ]+) provider: (?<provider>[^ ]+) metadata length: (?<metadata_length>\d+)" | where concept_type = ":granule" | eval source_version_split = split(source_version, "."), target_version_split = split(target_version, "."), source_major = tonumber(mvindex(source_version_split, 0)), source_minor = if(mvcount(source_version_split) > 1, tonumber(mvindex(source_version_split, 1)), 0), source_patch = if(mvcount(source_version_split) > 2, tonumber(mvindex(source_version_split, 2)), 0), target_major = tonumber(mvindex(target_version_split, 0)), target_minor = if(mvcount(target_version_split) > 1, tonumber(mvindex(target_version_split, 1)), 0), target_patch = if(mvcount(target_version_split) > 2, tonumber(mvindex(target_version_split, 2)), 0), version_distance = abs(source_major - target_major) * 10000 + abs(source_minor - target_minor) * 100 + abs(source_patch - target_patch) | chart median(ms_migrate), perc95(ms_migrate) over version_distance |
...
- Here we check for a correlation between umm-lib transformation time and length of concept metadata in characters, and fail to observe an obvious correlation.
- Decrease in variability at the high ends occurs in bins that have too few events. (6 or even less)
- Three graphs are shown below, so that we may examine total time, generate step time, and parse step time separately. (With median, 75th, and 95th percentile shown for each) Recall that generate step + parse step = total time.
Chart F1 - Total Time
| UI Expand | ||
|---|---|---|
| ||
log_group="cmr-search-wl" "transform-with-strategy umm-lib:" "target-formats: [{:format :umm-json" earliest="06/05/2023:00:00:00" latest="06/05/2023:23:59:00" | rex "transform-with-strategy umm-lib: legacy/parse-concept time: (?<ms_parse>\d+) reduce w/ legacy/generate-metadata time: (?<ms_generate>\d+) concept-mime-type: application/(?<mime_type>[^ ]+)" | rex "parent request num-concepts: (?<num_concepts>\d+)" | rex "provider: (?<provider>[^ ]+) metadata length: (?<metadata_length>\d+)" | where mime_type="echo10+xml" | eval ms_total = ms_parse + ms_generate | bin metadata_length span=300 | chart median(ms_total), perc75(ms_total), perc95(ms_total) over metadata_length |

Chart F2 - Generate Time
| UI Expand | ||
|---|---|---|
| ||
log_group="cmr-search-wl" "transform-with-strategy umm-lib:" "target-formats: [{:format :umm-json" earliest="06/05/2023:00:00:00" latest="06/05/2023:23:59:00" | rex "transform-with-strategy umm-lib: legacy/parse-concept time: (?<ms_parse>\d+) reduce w/ legacy/generate-metadata time: (?<ms_generate>\d+) concept-mime-type: application/(?<mime_type>[^ ]+)" | rex "parent request num-concepts: (?<num_concepts>\d+)" | rex "provider: (?<provider>[^ ]+) metadata length: (?<metadata_length>\d+)" | where mime_type="echo10+xml" | eval ms_total = ms_parse + ms_generate | bin metadata_length span=300 | chart median(ms_generate), perc75(ms_generate), perc95(ms_generate) over metadata_length |
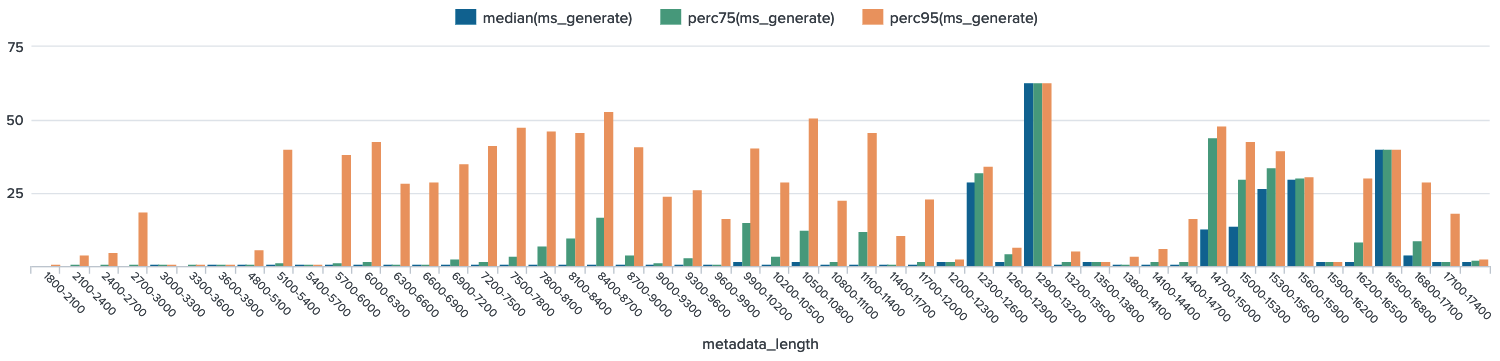
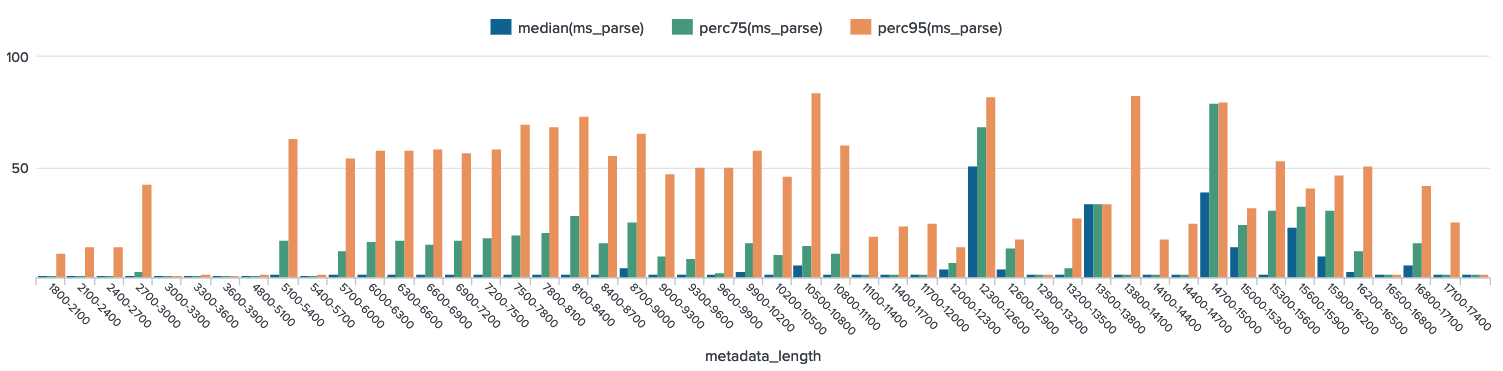
Chart F3 - Parse Time
| UI Expand | ||
|---|---|---|
| ||
log_group="cmr-search-wl" "transform-with-strategy umm-lib:" "target-formats: [{:format :umm-json" earliest="06/05/2023:00:00:00" latest="06/05/2023:23:59:00" | rex "transform-with-strategy umm-lib: legacy/parse-concept time: (?<ms_parse>\d+) reduce w/ legacy/generate-metadata time: (?<ms_generate>\d+) concept-mime-type: application/(?<mime_type>[^ ]+)" | rex "parent request num-concepts: (?<num_concepts>\d+)" | rex "provider: (?<provider>[^ ]+) metadata length: (?<metadata_length>\d+)" | where mime_type="echo10+xml" | eval ms_total = ms_parse + ms_generate | bin metadata_length span=300 | chart median(ms_parse), perc75(ms_parse), perc95(ms_parse) over metadata_length |
...
" | rex "transform-with-strategy umm-lib: legacy/parse-concept time: (?<ms_parse>\d+) reduce w/ legacy/generate-metadata time: (?<ms_generate>\d+) concept-mime-type: application/(?<mime_type>[^ ]+)" | rex "parent request num-concepts: (?<num_concepts>\d+)" | rex "provider: (?<provider>[^ ]+) metadata length: (?<metadata_length>\d+)" | where mime_type="echo10+xml" | eval ms_total = ms_parse + ms_generate | bin metadata_length span=300 | chart median(ms_parse), perc75(ms_parse), perc95(ms_parse) over metadata_length |
Tables G1, G2 - umm-lib transformation by provider
Breaking down by provider might illuminate a relationship with metadata_length. For readability, both queries below exclude 3 providers (SEDAC, ORNL_CLOUD, GES_DISC) which were severely under-represented (10 or less events).
Table G1 - total time by provider
| UI Expand | ||
|---|---|---|
| ||
log_group="cmr-search-wl" "transform-with-strategy umm-lib:" "target-formats: [{:format :umm-json" earliest="06/05/2023:00:00:00" latest="06/05/2023:23:59:00" | rex "transform-with-strategy umm-lib: legacy/parse-concept time: (?<ms_parse>\d+) reduce w/ legacy/generate-metadata time: (?<ms_generate>\d+) concept-mime-type: application/(?<mime_type>[^ ]+)" | rex "parent request num-concepts: (?<num_concepts>\d+)" | rex "provider: (?<provider>[^ ]+) metadata length: (?<metadata_length>\d+)" | where mime_type="echo10+xml" | where provider != "SEDAC" AND provider != "ORNL_CLOUD" AND provider != "GES_DISC" | eval ms_total = ms_parse + ms_generate | eval chars_per_parse_ms = metadata_length / ms_parse | eval chars_per_gen_ms = metadata_length / ms_generate | stats median(ms_total), perc75(ms_total), perc85(ms_total), perc95(ms_total), median(metadata_length), count by provider |
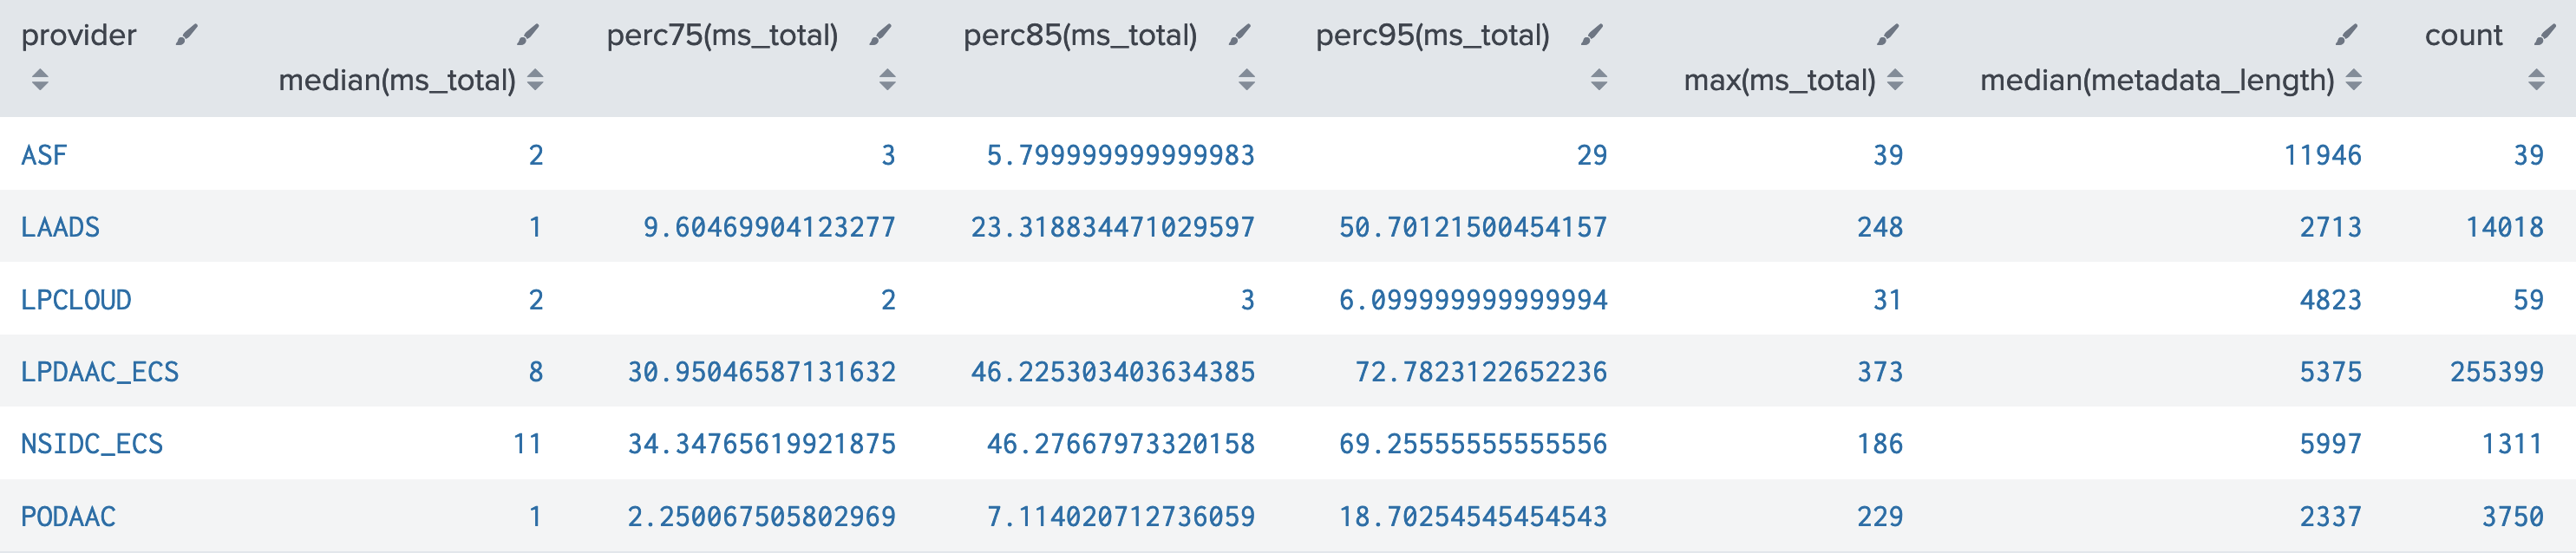
- This table shows each provider's median metadata_length (length of granule concept being transformed), alongside various percentiles, and max, of total time for the umm-lib step. The reason for so many percentiles alongside max is to check whether a provider's data might contain excessive outliers.
- LPDAAC_ECS and NSIDC_ECS are relatively slower than other providers:
- their medians (50th percentiles) are significantly higher
- their 95th percentile values are grossly higher, but even the 75th and 85th are already reaching around half the value of the 95th
- Other providers also show some slowing behavior, depending on how to define slow.
- Note that LPDAAC_ECS is the grand majority of events at 93% of the 274,576 total events
Table G2 – Metadata characters processed per millisecond, by provider
| UI Expand | ||
|---|---|---|
| ||
log_group="cmr-search-wl" "transform-with-strategy umm-lib:" "target-formats: [{:format :umm-json" earliest="06/05/2023:00:00:00" latest="06/05/2023:23:59:00" | rex "transform-with-strategy umm-lib: legacy/parse-concept time: (?<ms_parse>\d+) reduce w/ legacy/generate-metadata time: (?<ms_generate>\d+) concept-mime-type: application/(?<mime_type>[^ ]+)" | rex "parent request num-concepts: (?<num_concepts>\d+)" | rex "provider: (?<provider>[^ ]+) metadata length: (?<metadata_length>\d+)" | where mime_type="echo10+xml" | where provider != "SEDAC" AND provider != "ORNL_CLOUD" AND provider != "GES_DISC" | eval ms_total = ms_parse + ms_generate | eval chars_per_parse_ms = metadata_length / ms_parse | eval chars_per_gen_ms = metadata_length / ms_generate | stats median(metadata_length), median(chars_per_parse_ms), median(chars_per_gen_ms), perc25(chars_per_parse_ms), perc25(chars_per_gen_ms), count by provider |

- The calculated fields named "chars per ms" are the result of taking the length of the granule being transformed, and dividing by the ms it takes to transform it, for both the parse and generate steps. The resulting units are "characters processed per ms", so a lower number means less characters processed per millisecond.
- Recall that the entire metadata is processed for both parse and generate steps, but for the generate step this is more of an estimate because the starting point is not the original string, but rather the result of the parse step.
- Generally, we would expect the median "chars per ms" to be very close to the median metadata_length, for the simple reason that most of the median transform step times were 1 ms. (E.g. 1500 chars/1 ms = 1500) This is exactly what's observed, with just 2 exceptions -- again LPDAAC_ECS and NSIDC_ECS, which both show much slower median chars per ms for the parse step. (but not generate step)
- 25th percentiles for chars per ms are given in order to examine the 'slowest' (less characters processed per ms) events. Which of these might be noteworthy depends on your definition of slow, some starting points:
- LPCLOUD doesn't vary, is incredibly steady across the board
- ASF exhibits 'slower' events only for parse, not generate
- Other remaining providers all show more slowing in parse than in generate, but they do show it in both. (how much is normal?)
Overview
Content Tools